Flooding Simulation
This page does several things: A crude simulation of a city-wide flood is presented, with some discussion about how it was made. There are also some thoughts about how simulation can be used as a communication tool, rather than as a predictive tool.Hopefully this might be interesting to other people who enjoy coding simulations, or might want to use them in science journalism or for educational purposes.
Simulations are usually used to try to predict how some complicated system will behave, or did behave. But they also allow the user to play around with parameters, modify the simulation, watch it, and get detailed information about aspects of the science that they might not be able to with a video, diagram or text.
Communicating science to a lay audience is normally complicated by the person not being familiar with terminology and perhaps not having a good enough mental models of what's going on to really understand a textual description. A diagram often helps, as would a video, but to actually present the key parts of how something works, something the reader can play with is possibly more useful. If you imagine how much someone can learn about landing a plane from diagrams and text, compared to being given a flight simulator to spend time in, it seems likely that the simulator would be the most efficient, and perhaps most fun way for the student to learn how the plane actually behaves.
The problem with simulations, though, is that they often were not easy to put into an easily communicated form: perhaps needing hardware, or a large installation on the reader's computer.
In the last ten or so years, though, javascript has become fast enough to run far more detailed simulations than used to be possible, and it can be given to the reader as easily as text can: All they need to do is go to a web page, and it runs automatically.
Another difficulty is that simulations do take longer to write than text. But often the slow part is the model validation step, and for communication purposes or education purposes, this might not be necessary.
With that slight justification, let's show the simulation. Later, I'll talk quickly about how it was made.
What this is
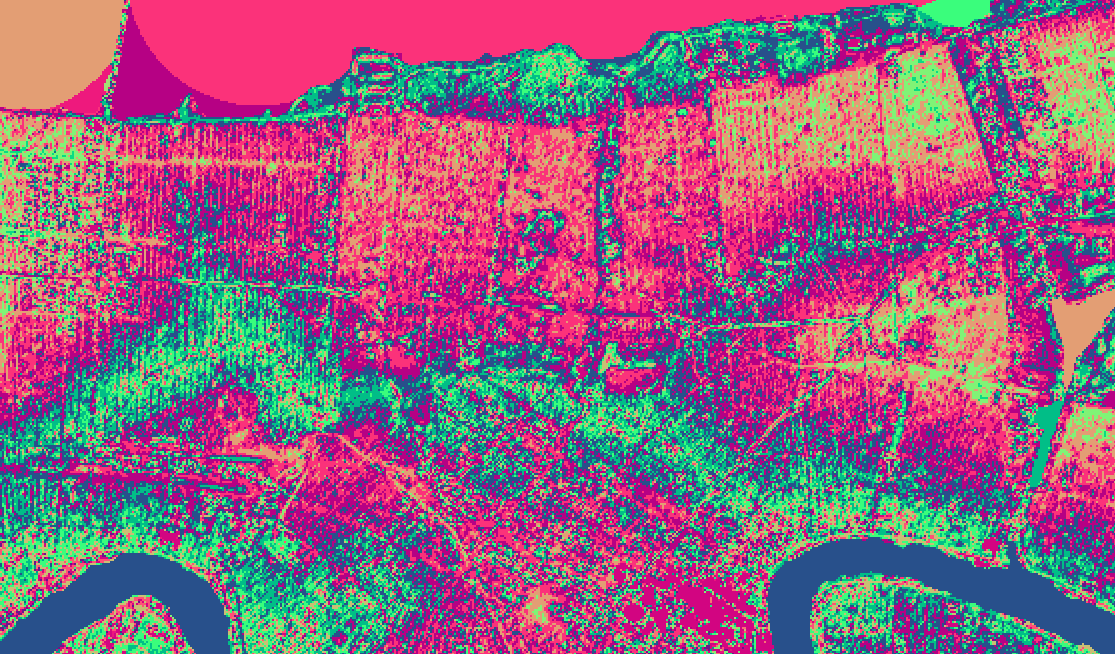
This is a very crude simulation of a potential flood of New Orleans. The pattern of flooding doesn't exactly match the 2005 flooding - and the places where the levees fail in this simulation aren't where they failed in 2005.Copyright notice: the original data is provided by JAXA. The data presented here is modified.
© JAXA
Do It Yourself
Here's how this simulation was made.Step 1. Get the digital elevation map
The source I used is from the Japanese space agency and is free to use (although a login is required). This just needs to be downloaded and unzipped. It's stored as a 16-bit tiff, which could be difficult to use if you don't have tools to process it. Fortunately I'm using C#, and C# is pretty easy to get things like that working.The data I used has a resolution of 1 arc second, or roughly 30m.
Another thing you'll need to do is cut the data down to the size you want. In my case, it looks like this:
Step 2. Process the map
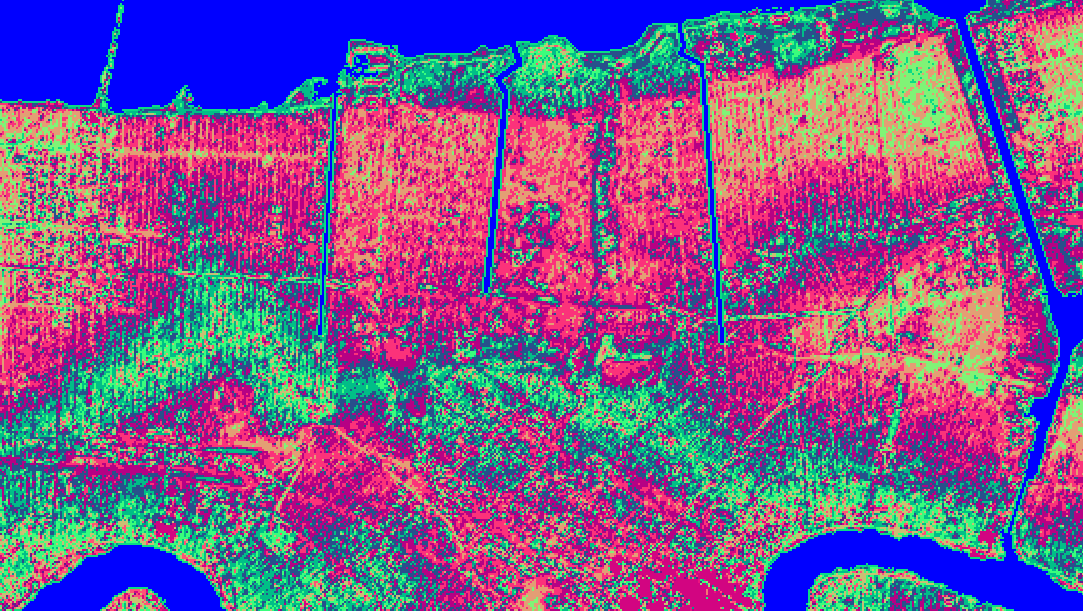
The map is just a height map at the moment. I used a C# program to make a data structure holding both height and water depth, and a few other things. The depth gets flood filled in a few places: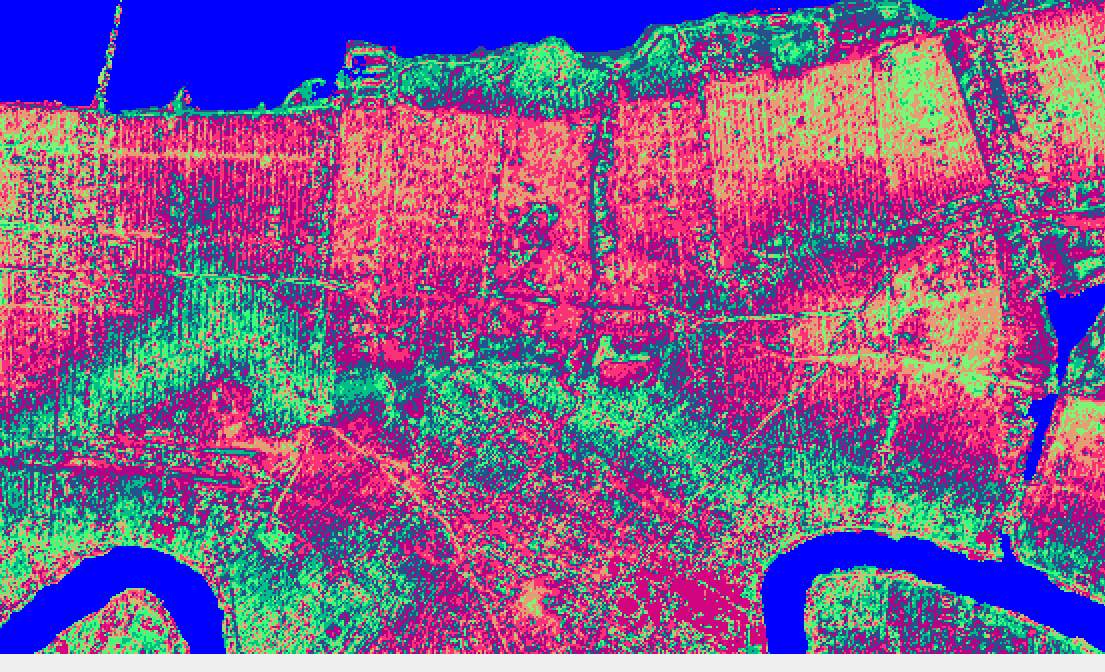
Two other things that need to happen are that the seawall is drawn back in, and canals are manually added. In both cases this is necessary because the resolution isn't high enough, and there are occasional points where the height isn't at sea- (or lake-) level where it should be.
Step 3. Draw it on an HTML canvas.
Javascript can make images really quickly, but the secret is to draw directly onto a bit array, rather than trying to draw rectangles on the canvas.There are several tricks in that --- which are easier to read in code than english. The following code basically copies an image in biggerData on to the canvas - in such a way that the canvas doesn't need to have the same size as biggerData. That's useful because we probably won't have a map the same size and shape as the canvas.
function display(flood) {
    var c = document.getElementById('main');
    var ctx = c.getContext('2d');
    var width = c.width;
    var height = c.height;
    var h = flood.height.length;
    var w = flood.height[0].length;
    if (!imageData) imageData = ctx.createImageData(width, height);
    if (!biggerData) {
        biggerData = [];
        for (var i = 0; i < w * h * 3; i++) biggerData[i] = 0;
    }
    recolour(flood);
    var data = imageData.data;
    for (var i = 0; i < width; i++) {
        for (var j = 0; j < height; j++) {
            var ind = (i + j * width) * 4;
            var x = (i * w / width) | 0;
            var y = (j * h / height) | 0;
            var c = (x + y * w) * 3;
            data[ind] = biggerData[c] & 0xff;
            data[ind + 1] = biggerData[c + 1] & 0xff;
            data[ind + 2] = biggerData[c + 2] & 0xff;
            data[ind + 3] = 255;
        }
    }
    ctx.putImageData(imageData, 0, 0);
}
The only thing missing is the recolour function (which actually colours in the map). You can look in this to see the code, but it's just what you'd expect.
Step 4. Simulate.
Water flows. We have two dimensions. Each point here is given three numbers: the water depth, the water flow to the left, and the water flow up and down.We're going to go for a really simple timestep:
- Apply some boundary conditions
- Update the flow
- Update the water depth
- Sometimes smooth the flow
The ground is assumed to erode in a similar way, but more so if the water is shallow.
Applying boundary conditions just means setting the water depth at the edge of the map to mimic storm inflow.
Smoothing the flow is necessary because the algorithm produces high-frequency oscillations - numerical artifacts.
Updating the flow could be really difficult: The water wave equation depends on depth and has dispersion. It's very difficult to get that to work fast. And we do need it fast for it to work as a communication method.
Instead, the flow is just going to be approximately calculated using the following algorithm:
- Take the difference in heights (including water depth)
- Update the flow proportionally
- Cap the flow so that no more than 25% of the water can leave each step.
- The flow rate isn't correct. The counter argument is that it would never be correct anyway: The flooding rate is dominated by the exact geometry around the breached levees. This geometry is smaller than the resolution of this simulation, so the exact flow rate would be something that would just have to be tuned with simulation parameters. This would be the case even if the flow rate was calculated accurately (but at this resolution).
- The dispersion isn't correct. This shouldn't be all that important: it is only really a factor for deep water, and says how fast different wavelengths move. Overall, no matter what this is, the same amount of water is going to reach the same places.
- Ground erosion isn't all that accurate. This is a problem, but it can't be solved unless you go through the pain of validating the model. The suggestion is that for a simulation where you're just trying to communicate a past event, the parameters of the simulation should be moved around until the erosion appears to be about right.
- Water doesn't carry momentum in the same way as real life. In some flooding events, this could be important, but for relatively slow floods, this might be a forgiveable inaccuracy.
Step 5. Validation. You don't have time to do this step.
There are two types of simulation. Validated simulations and unvalidated simulations.Validation is where you go to the immense effort of cross checking the simulation against reality.
It's normally really easy and fast to make an unvalidated simulation: You just write it. You often can't use them to make predictions, though, because normally you have little reason to trust them. However, if you're just trying to make a simulation to show how something happened historically (when you already know the outcome), you don't have to validate the simulation.
Validating a simulation is a huge amount of work - The simulation here took perhaps 5 or 6 hours of coding (not including making the map / drawing on canvas). Validating it might take more like a year: You'd have to write tests, get hold of real life accurate data. Cross check them, etc., etc.
If your aim is communication, the simple reality is that you don't have time to validate it. Once that's accepted, you're done.
Other Articles:
|
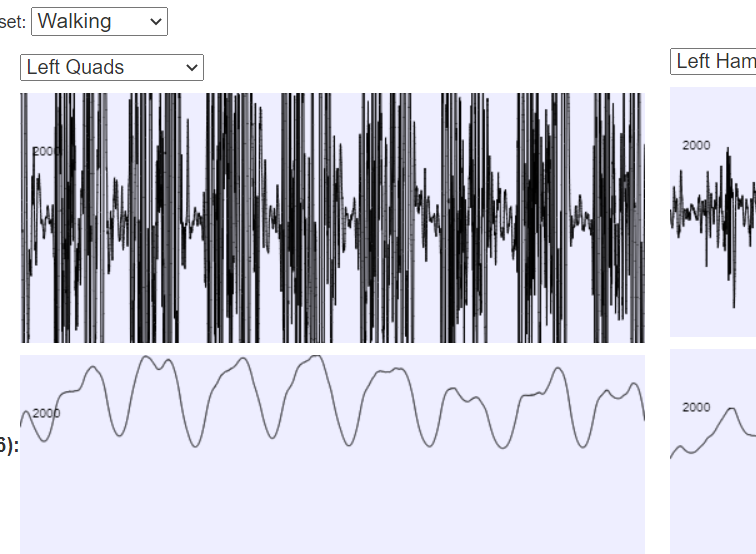
BodyWorks: EMG AnalysisA page with a javascript application where you can interact with EMG data using various filters. |
|
Moon FormationA Kotlin N-Body code, and lots of animations of the collision between Earth and a hypothetical Theia that people think created the moon. |
Three Crystal StructuresA ThreeJS model of three crystal structures |
|
© Hugo2015. Session @sessionNumber