Loading or javascript not enabled.
Other Articles:
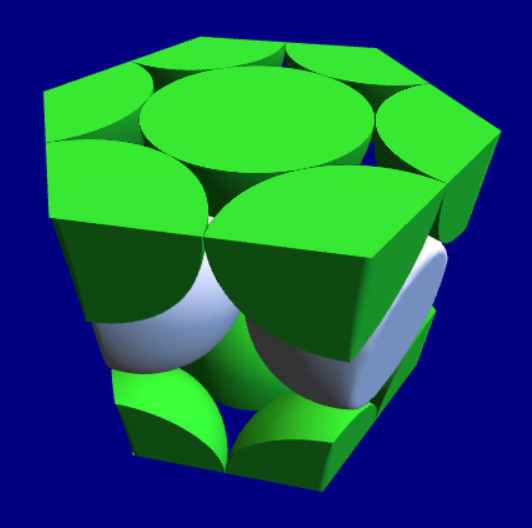
Three Crystal StructuresA ThreeJS model of three crystal structures |
|
|
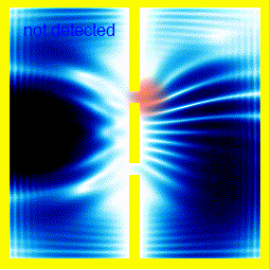
The double slit and observersA look at the double slit experiment. The first half is meant to be a clear explanation, using simulations. The second half discusses some of the philosophy / interpretations of quantum mecahnics. |
|
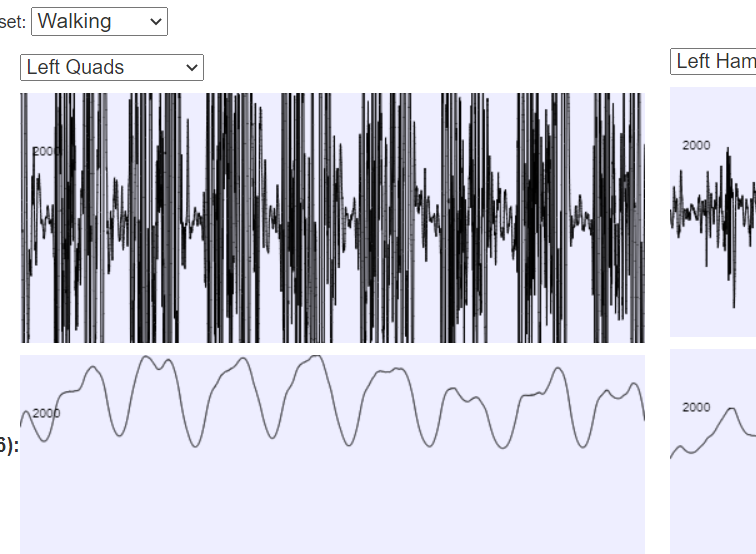
BodyWorks: EMG AnalysisA page with a javascript application where you can interact with EMG data using various filters. |