Science Saturdays, Year 1: Seasonal Changes/Weather
Science Saturdays are sessions which teach parents/carers and children valuable STEM skills. Our goals are to increase parents' confidence in STEM skills and STEM
activities, while providing the children opportunities to play with STEM toys, such as magnifying glasses. Another goal is to increase the community
amongst the year-group families. These sessions are appropriate for schools to use in the classroom, families to do as extra learning outside school, and/or for
families who Home School / Home Educate.
This series of webpages is intended to help others set up their own Science Saturdays. We hope these webpages are helpful and help us grow our collective STEM skills
for the future!
Team:
Mridusmita Danciu: Medical Professional
Nicolae Danciu: Aircraft Engineer
Barbara Vohmann: Quantity Surveying and Construction Management Academic
Ephraim Zulu: Quantity Surveying Academic
Sarinova Simanjuntak: Mechanical Engineering Academic
Jennifer Martay: Biomedical Engineering Academic
We focused on Seasonal Changes / Weather in our fourth and final Year 1 Science Saturday. We used STEM Learning UK's "Science for Starters"
Seasonal Changes leaflet as a basis for the session.
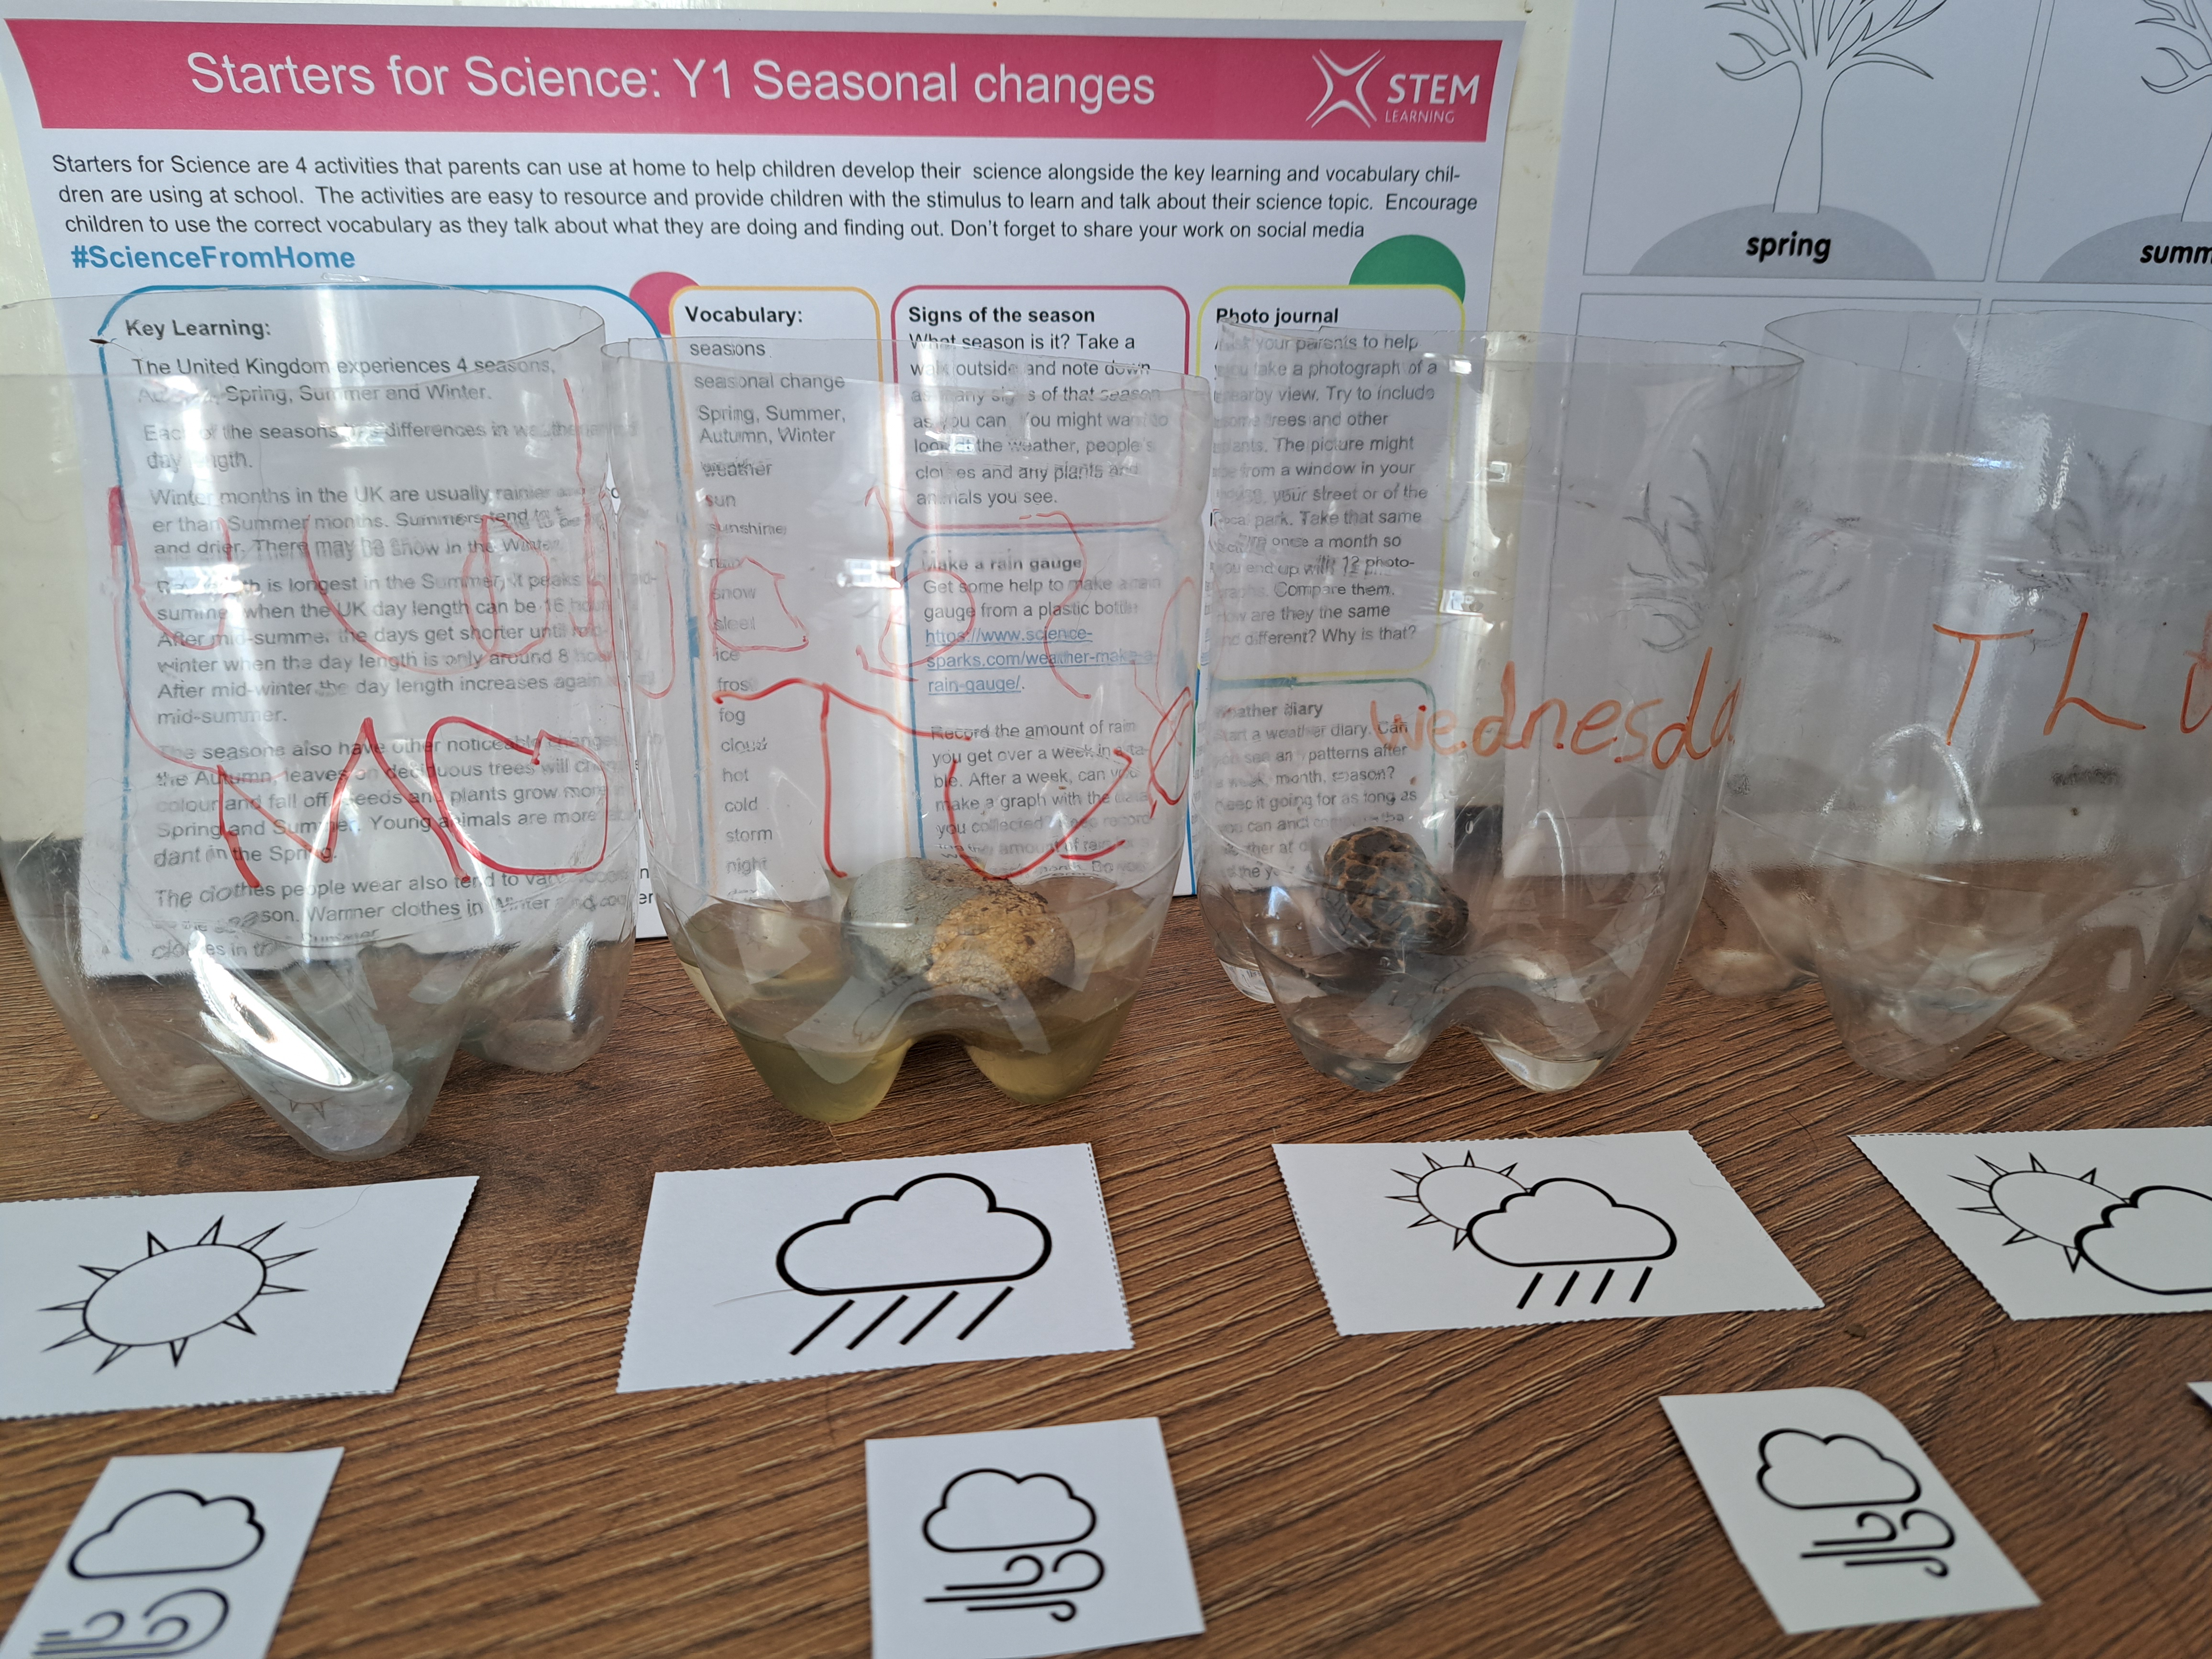
Required Materials (for 10 Families)
-10 STEM Learning leaflets on Seasonal Changes, Cost = £0
- 10 2L plastic bottles without plastic labelling, cut bottom to make rain gages (week before) and cut middle section for wind socks, Cost = £0
-
Hole punch for putting holes in plastic wind socks (or can use drill or hammer nail through etc), Cost = £8.49
-
12 rolls of colourful ribbons, 6mm width, for decorating wind socks, Cost = £8.99
-
8 rolls of colourful tape for decorating wind socks , Cost = £7.99
-
Pens for drawing/colouring trees and decorating wind socks, Cost = £11.50 for 187 piece art kit
-
10 sets of seasonal trees , Cost = £0
-
1 copy to show weather symbols (p2-3), Cost = £0
-
1 copy to show wind symbols, wind socks, and Beaufort Scale , Cost = £0
-
YouTube video to show Beaufort Scale , Cost = £0
Total Cost = £36.97
Total Cost per Child = £3.70
Note: The above Total Cost per Child is slightly misleading! The arts set was already used in the 1st, 2nd, and 3rd Science Saturday session
so don't need to be re-bought. The hole punch is non-consumable and could be used again/in future sessions (and you may already have
a drill or hammer/nail which could be used instead).
Total Cost if coloured paper and pens already available from Session 1 and/or 2 = £25.47
Total Cost per Child = £2.55
Plan for Session
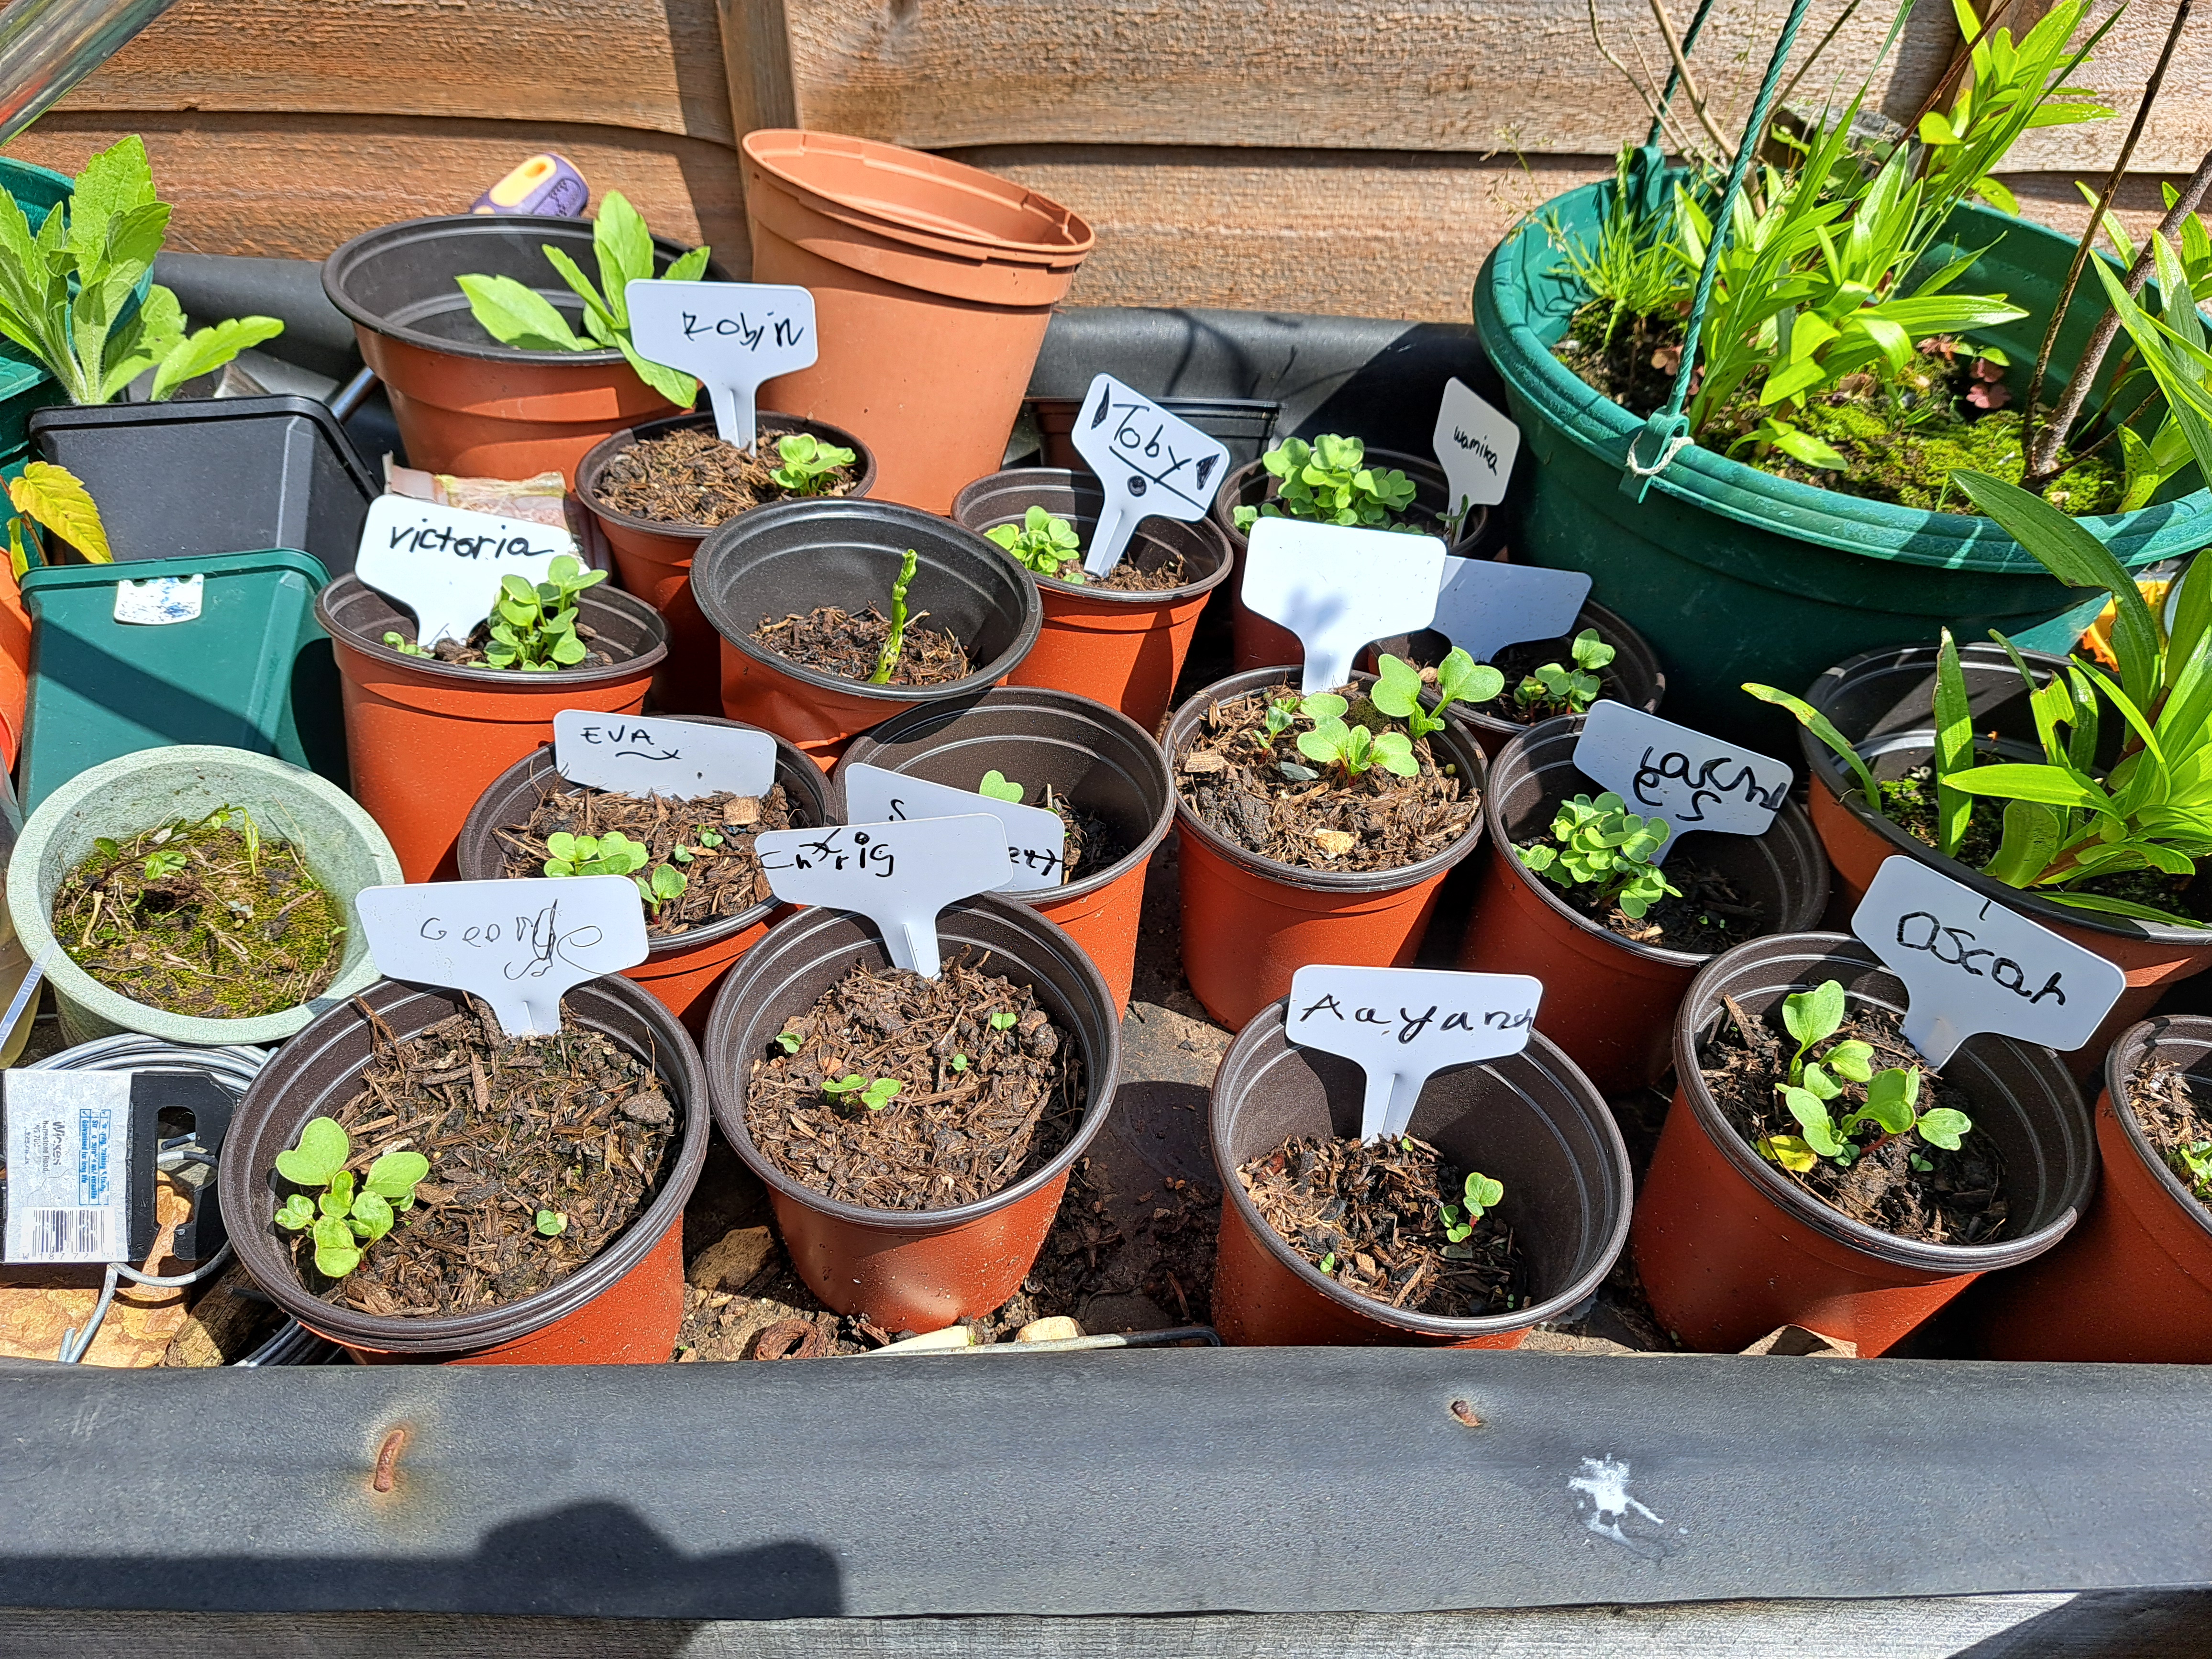
1. Welcome families: Let children check their plant from Session 1 (ours had started sprouting). Have parents put on name tags so
people can learn names. Ask parents to
take 4th survey (or earlier survey if family missed a session). Ask newly-joining families if they are ok with pictures being taken/shared.
2. Introduce weather symbols: Lay weather cards in front of children and ask them each to select a card they recognize and to explain
their selected card to the group.
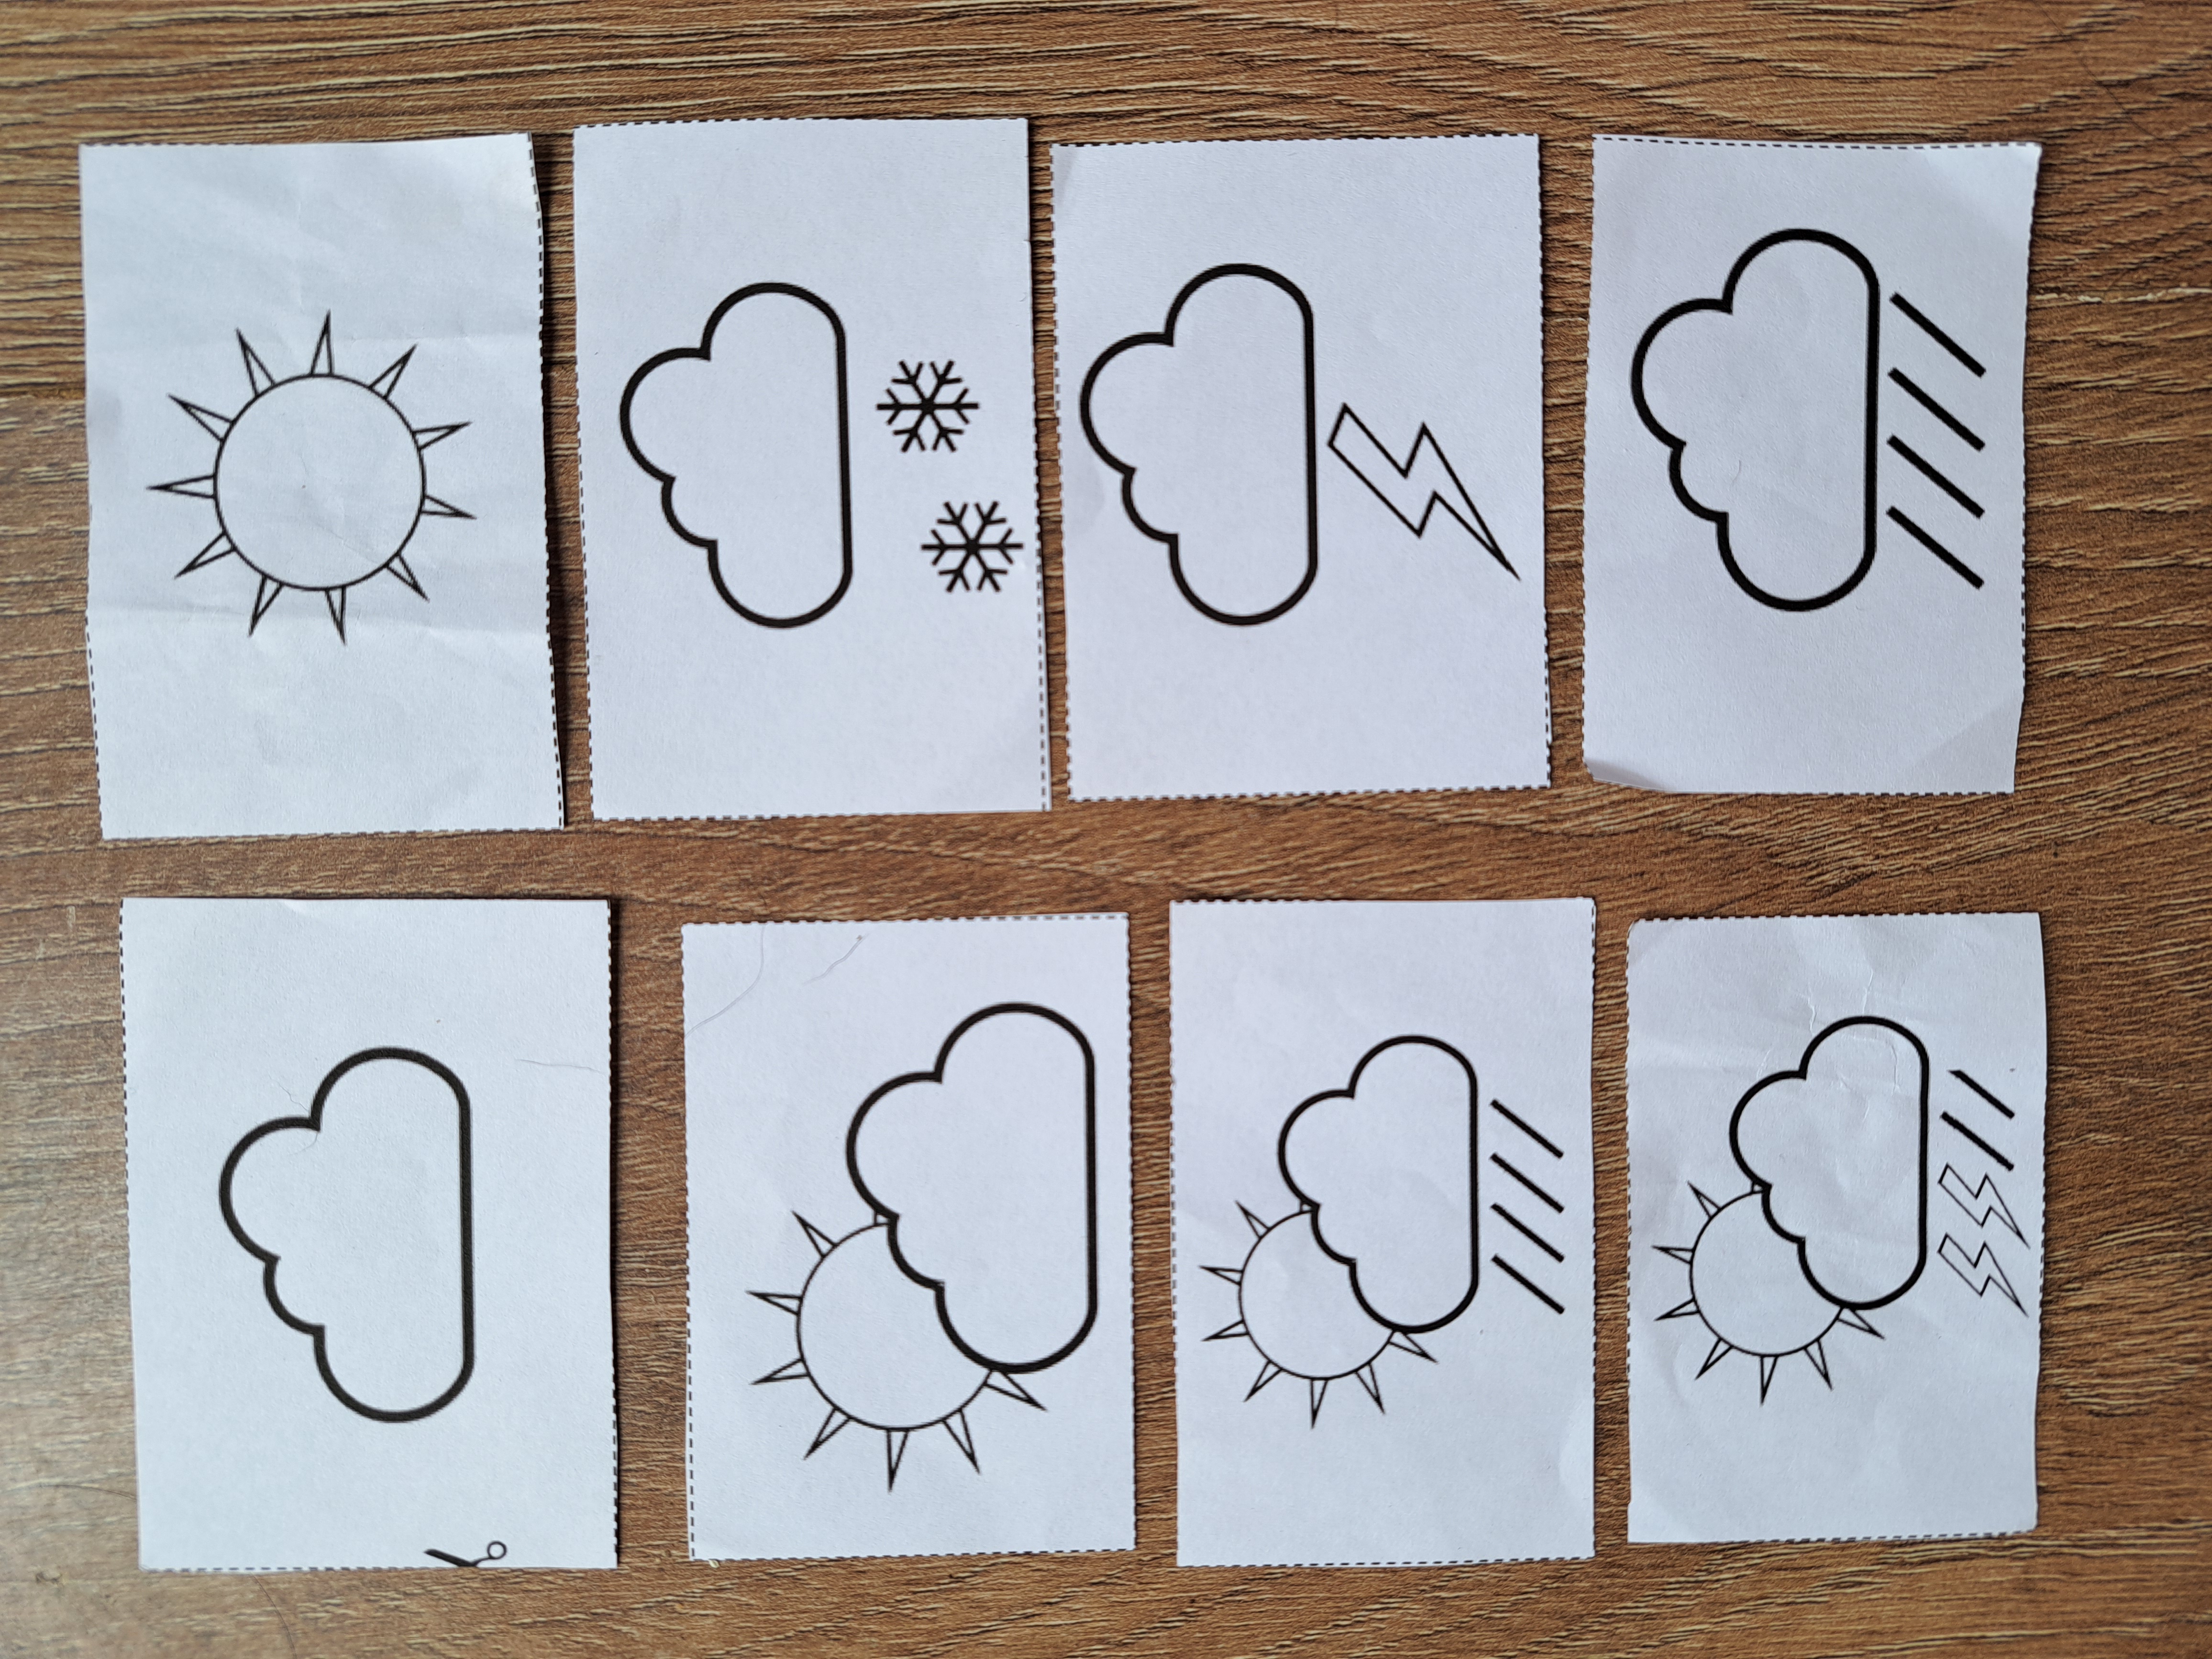
3. Identifying the weather: Have children identify the weather symbol which represents the weather now, earlier today, and earlier this week. Ask children to
justify their answers if multiple answers are given.
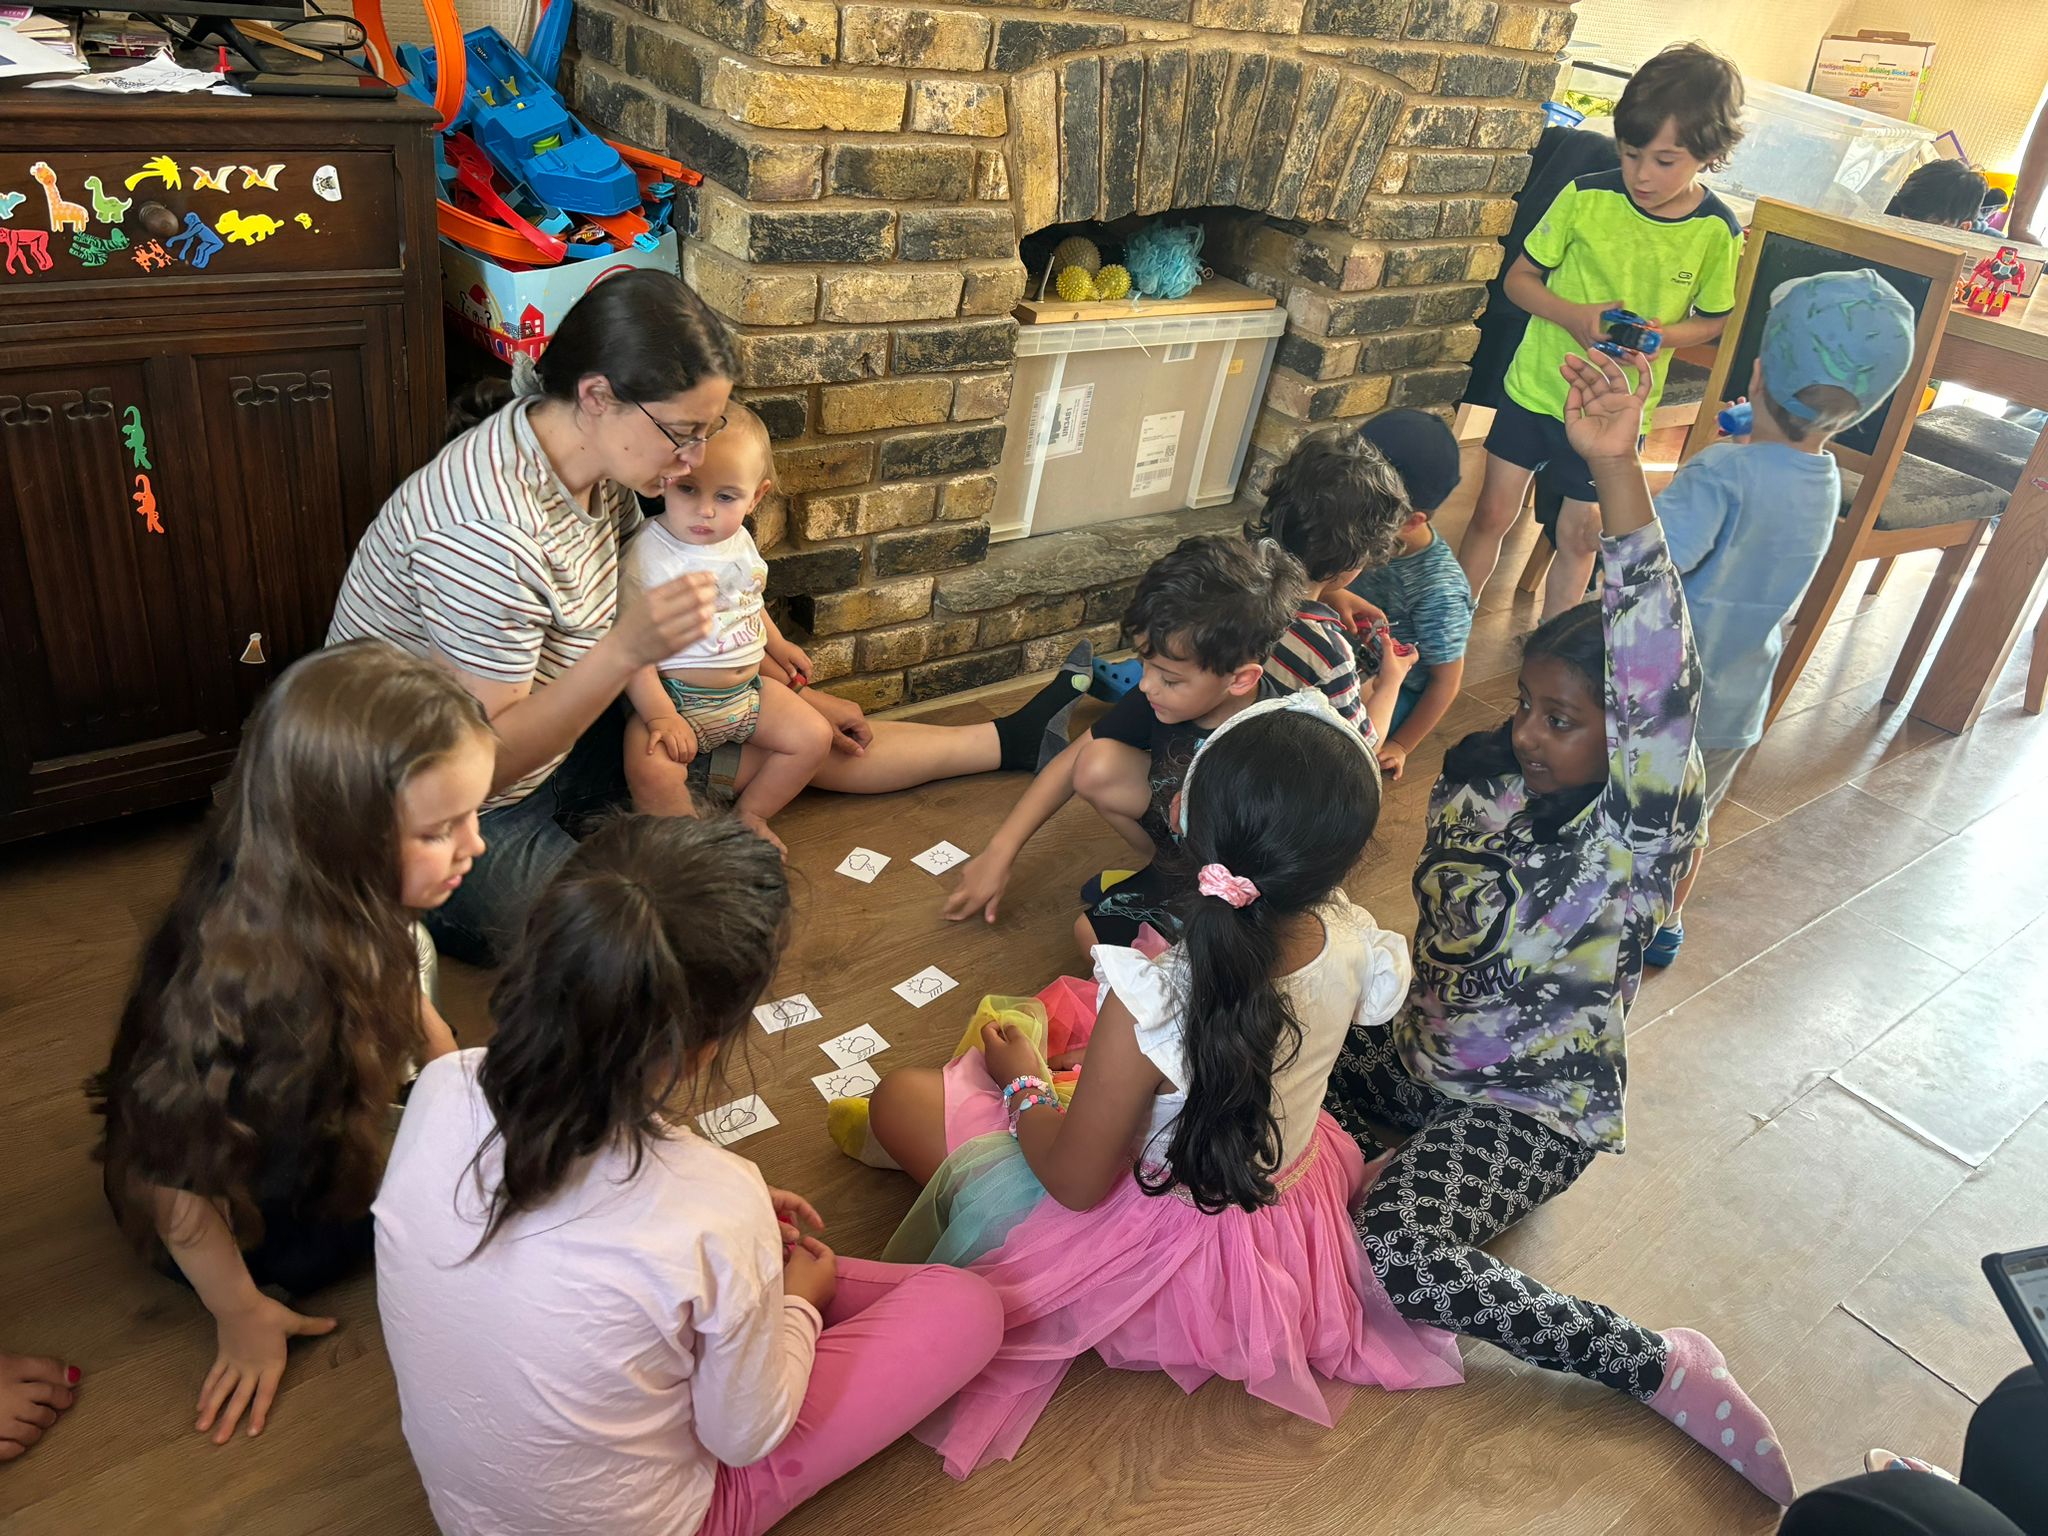
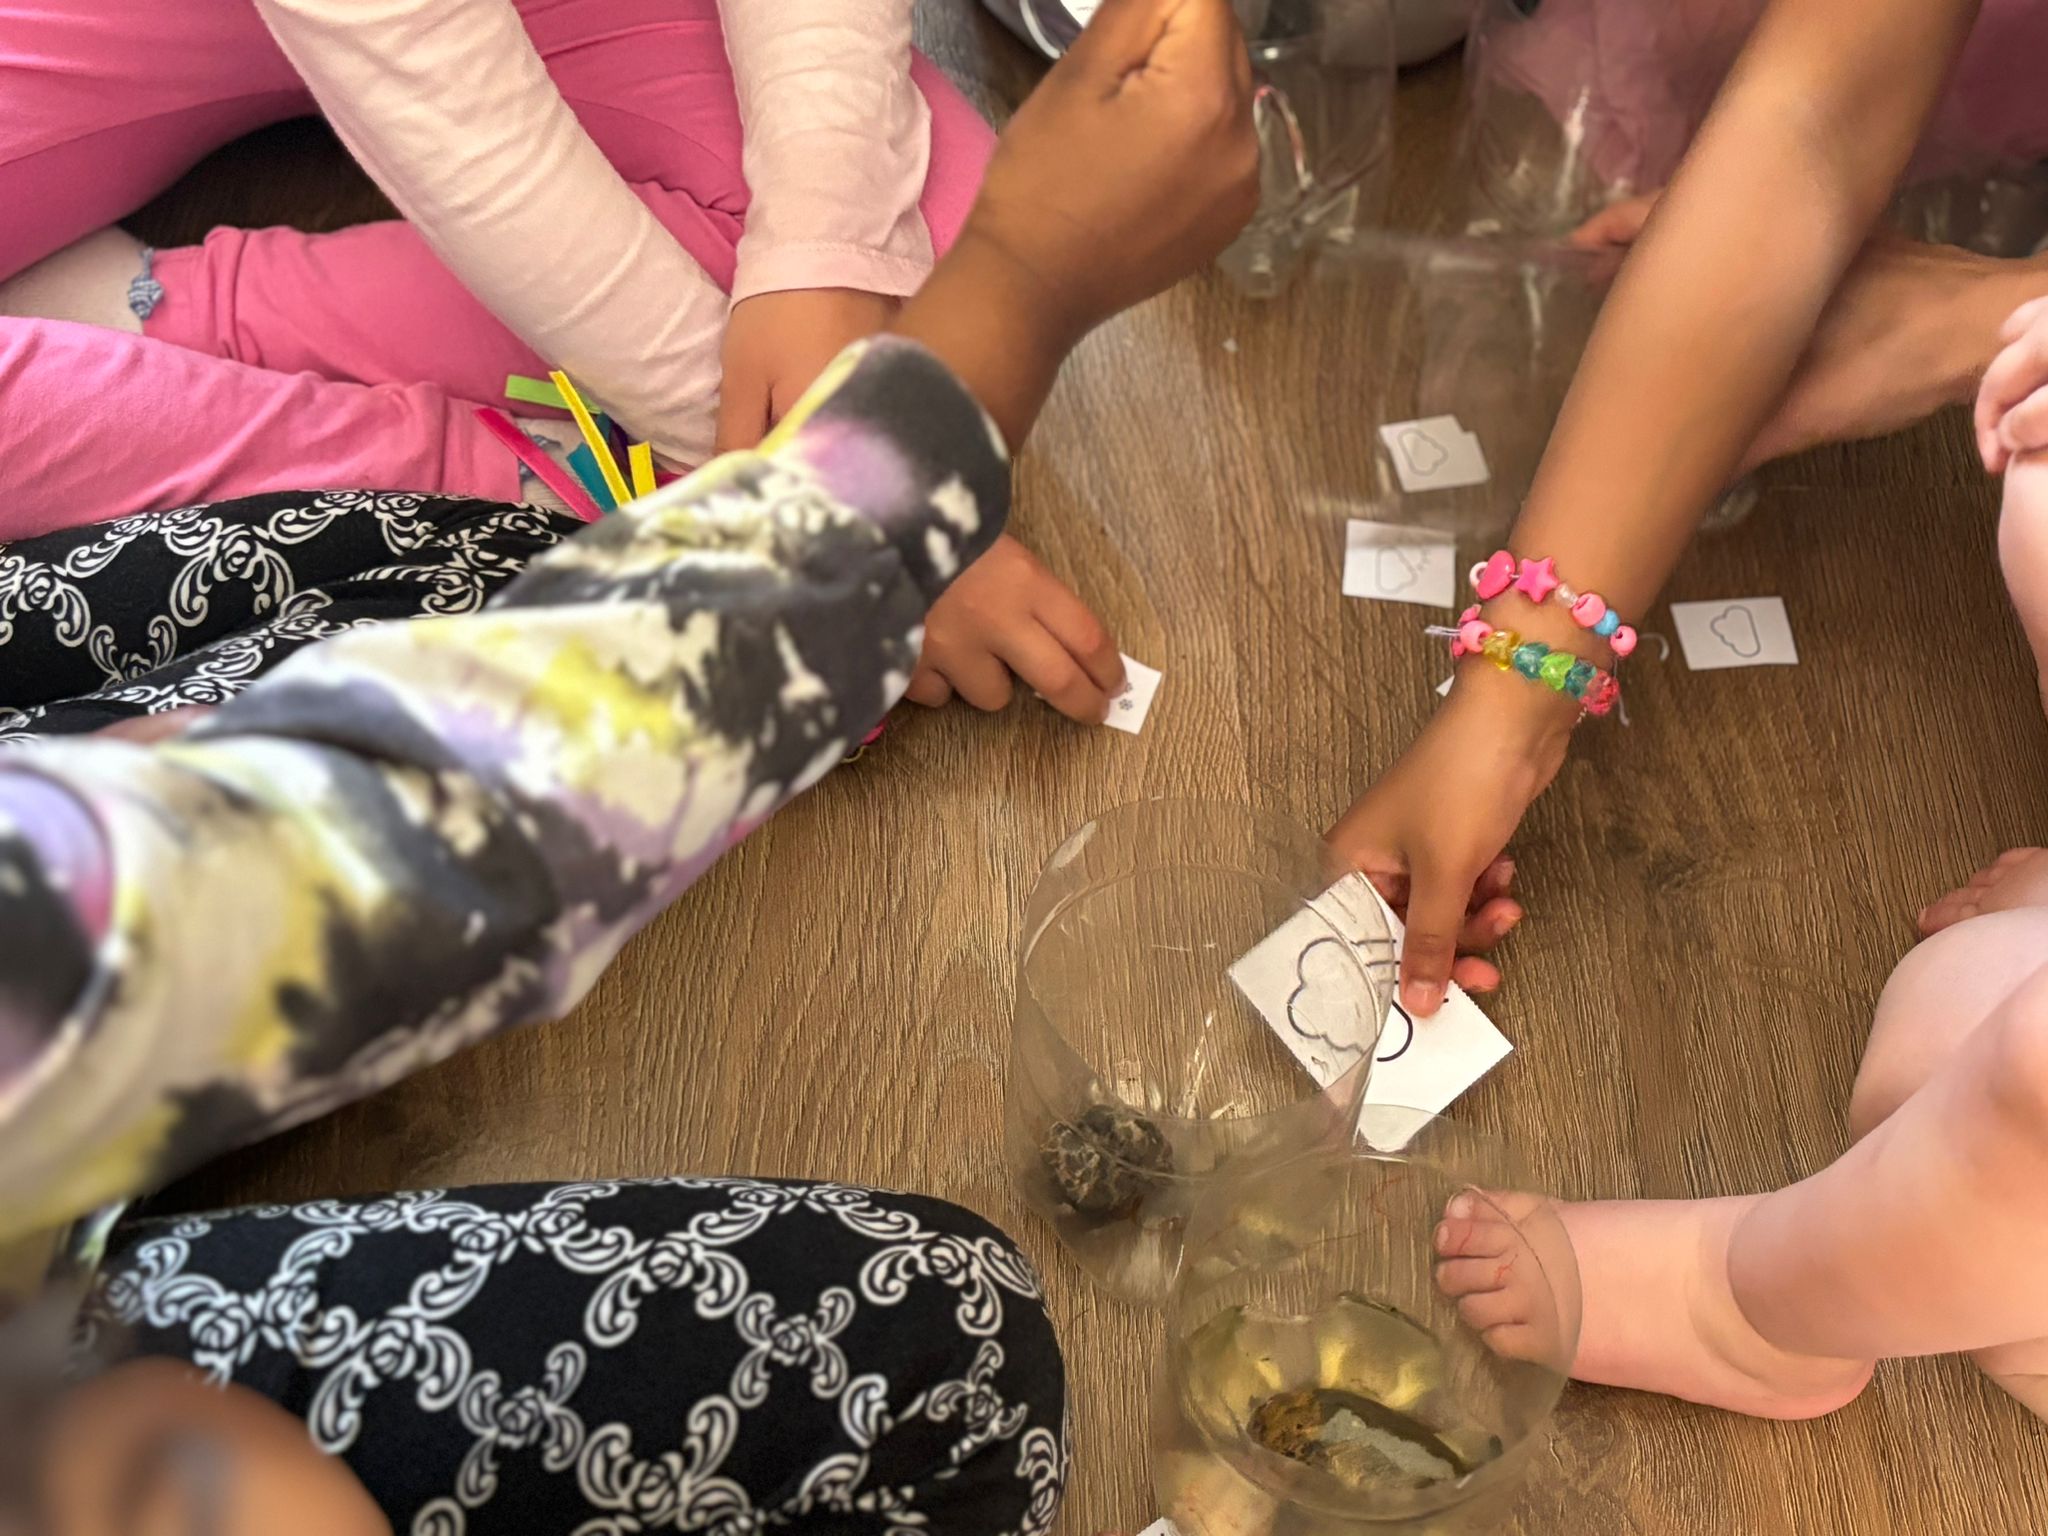
4. Rain gage activity: Place the previous week's rain gages in front of the group on the floor (careful not to spill any with water!). Ask
children which day it is today (for us, Saturday) and have children read rain gages and find the one labelled "Saturday". Ask children what day
comes next (for us, it was Sunday). Have children read the rain gage labels and identify the gage with "Sunday" written on it. Continue until
children have ordered all rain gages from the week. Then ask children to put the relevant weather symbol card(s) under each day. This
activity invites discussion about how rain in the rain gage only tells us that it rained that day - not whether it rained all day or only
part of the day. You can also discuss how water in the rain gage could be melted snow or rain (particularly if it's winter).
The group can also discuss how a lack of rain in the rain gage does not tell us whether it was sunny or cloudy. Segway to the next
activity by explaining that rain is only one way to describe the weather, and that other ways also exist.
5. Describing weather based on the wind: Ask children to look at the trees outside and describe how windy it is. When
children give variations of answers (some may say "very windy" or "a little windy" or "pretty windy", etc), point out that different
people used different words to describe the same thing. Explain that science uses agreed-upon numerical scales to avoid this confusion.
Show YouTube video of Beaufort Scale. The video is less than 1.5 minutes and shows how water, trees, and a wind sock are affected
by wind at different levels of the Beaufort Scale.
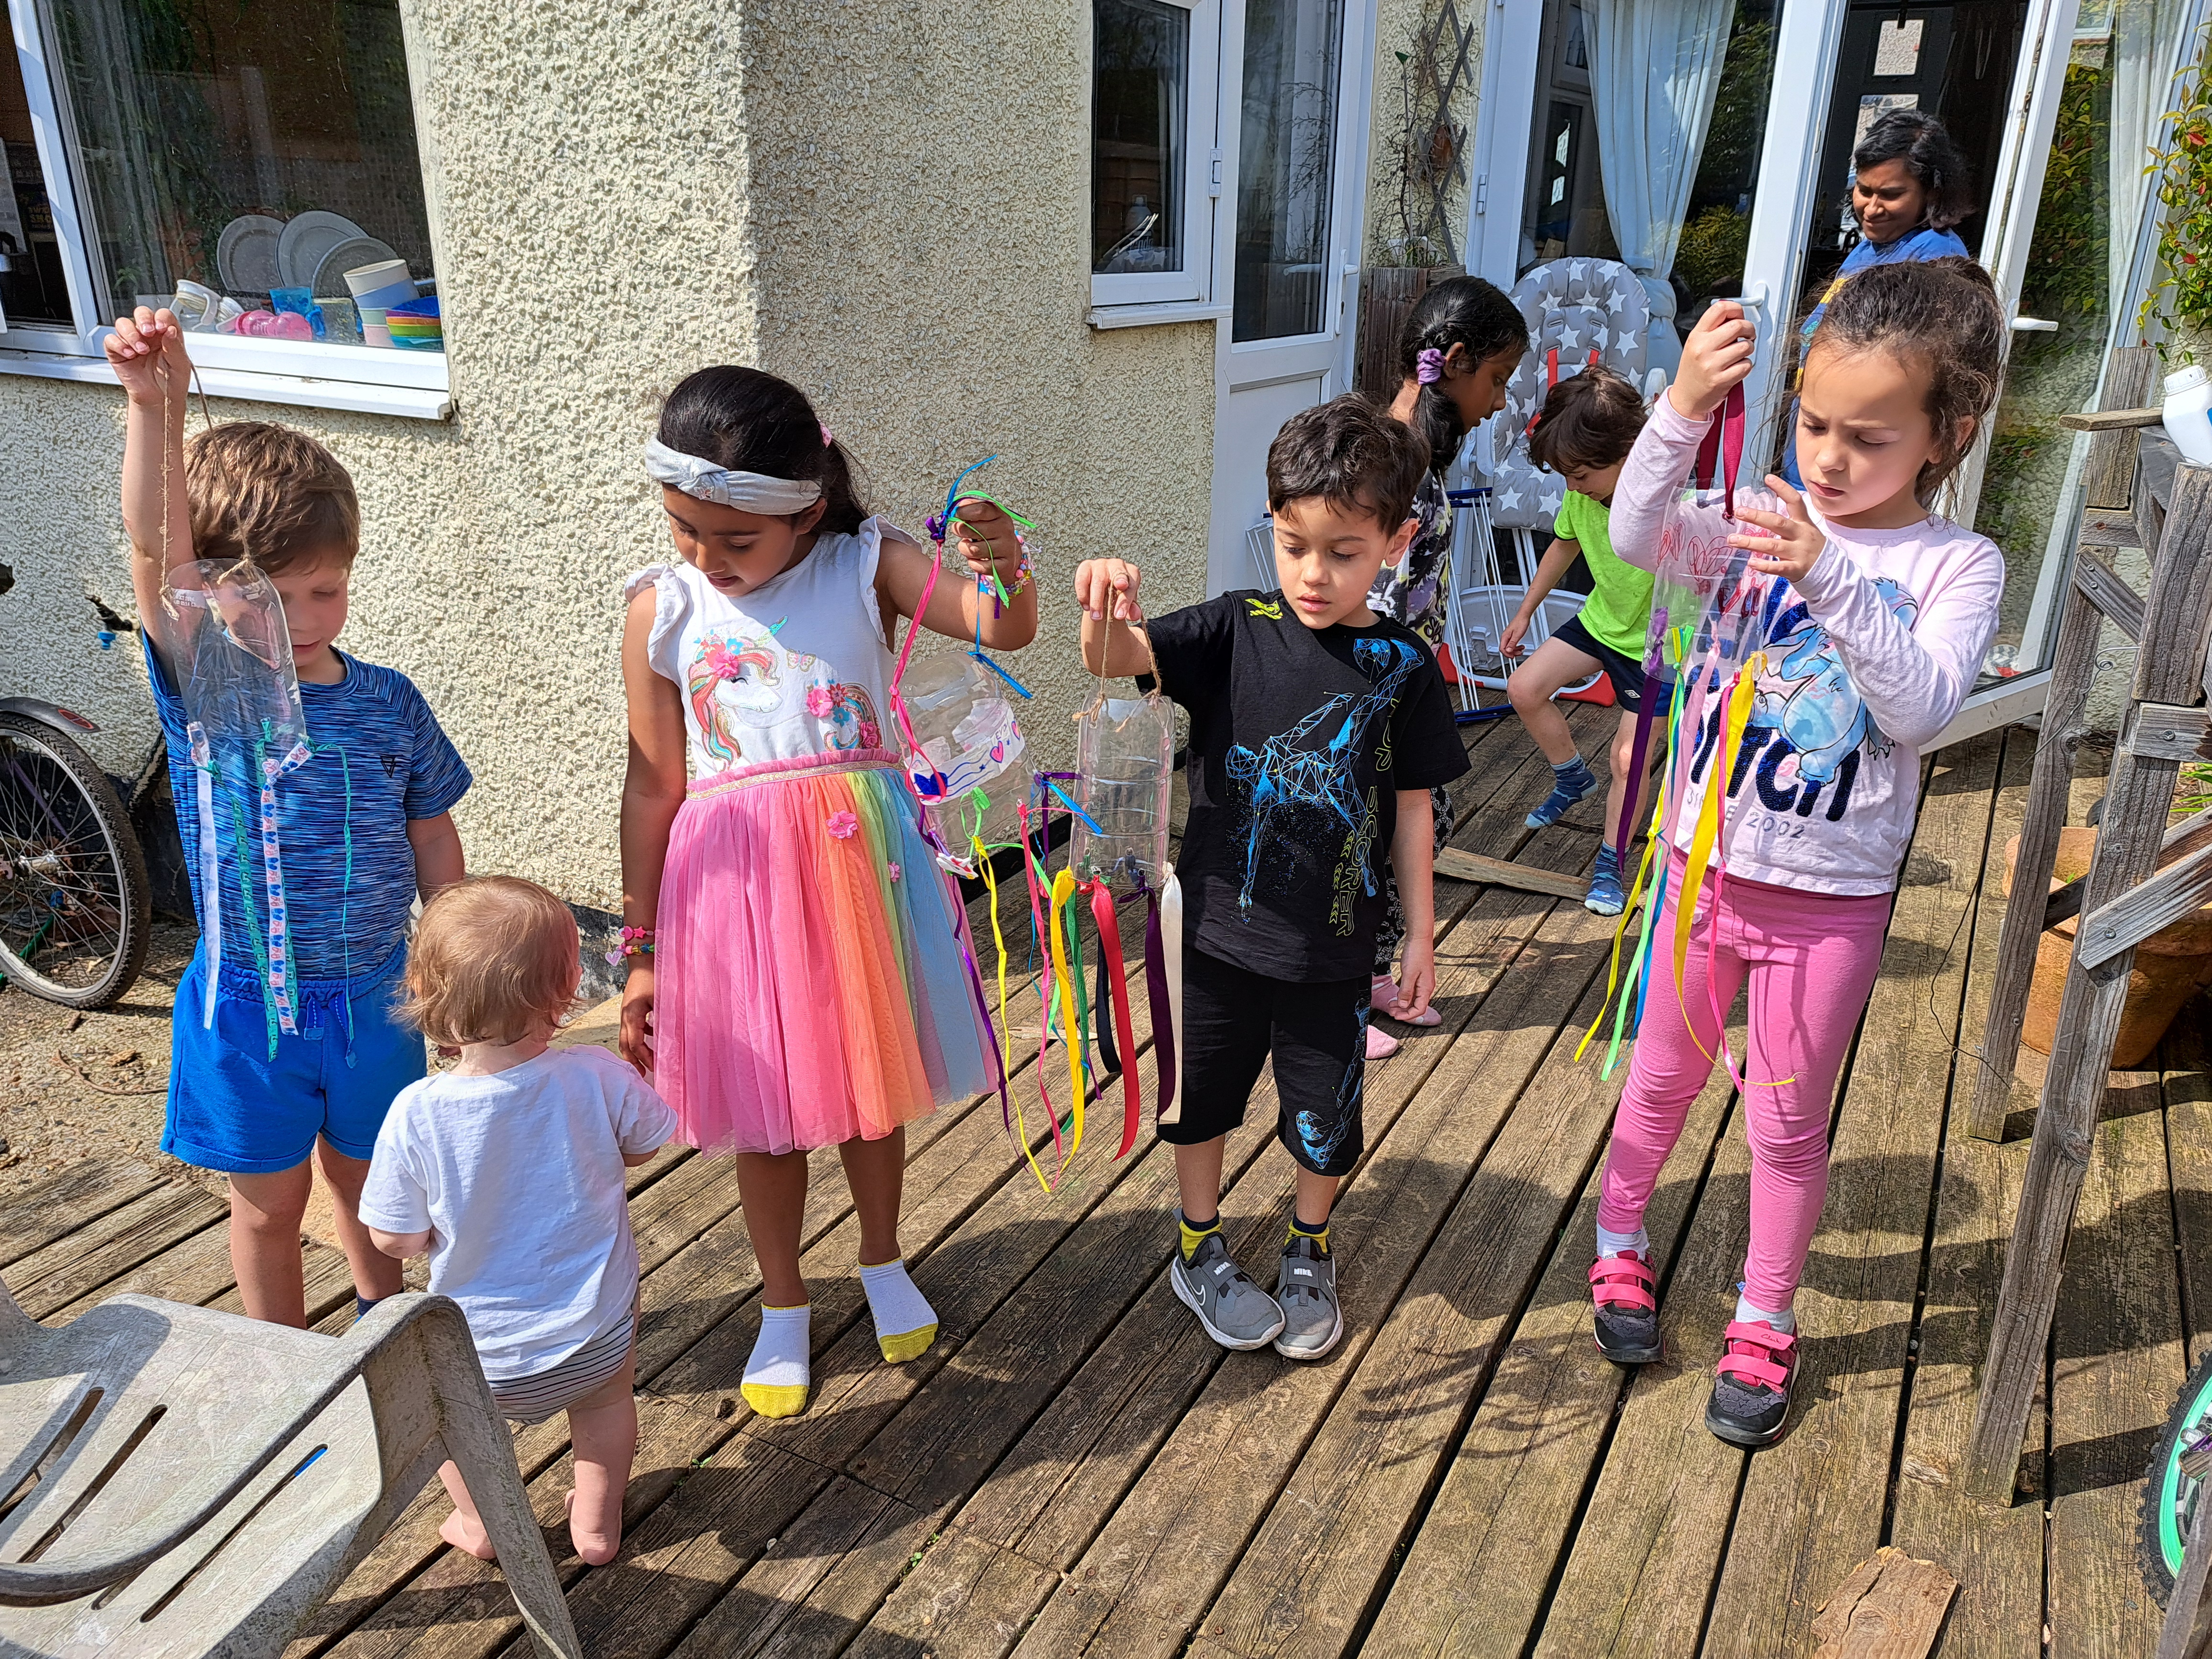
6. Wind sock activity: Give each family a wind sock base. Allow families to decorate their wind sock with colourful ribbons and tape.
Then use wind socks outside (if not raining) and estimate wind strength on Beaufort Scale. A great photo opportunity!
7. Discuss seasons: Highlight that the weather (temperature, amount of rainfall/snow, hours of sunlight) varies throughout the
seasons of the year. Ask
children to name the seasons. This sparked interesting inter-cultural discussions as some families had ties to other areas of the world
which had fewer or more than 4 seasons. Invite families to discuss their different seasons with the group.
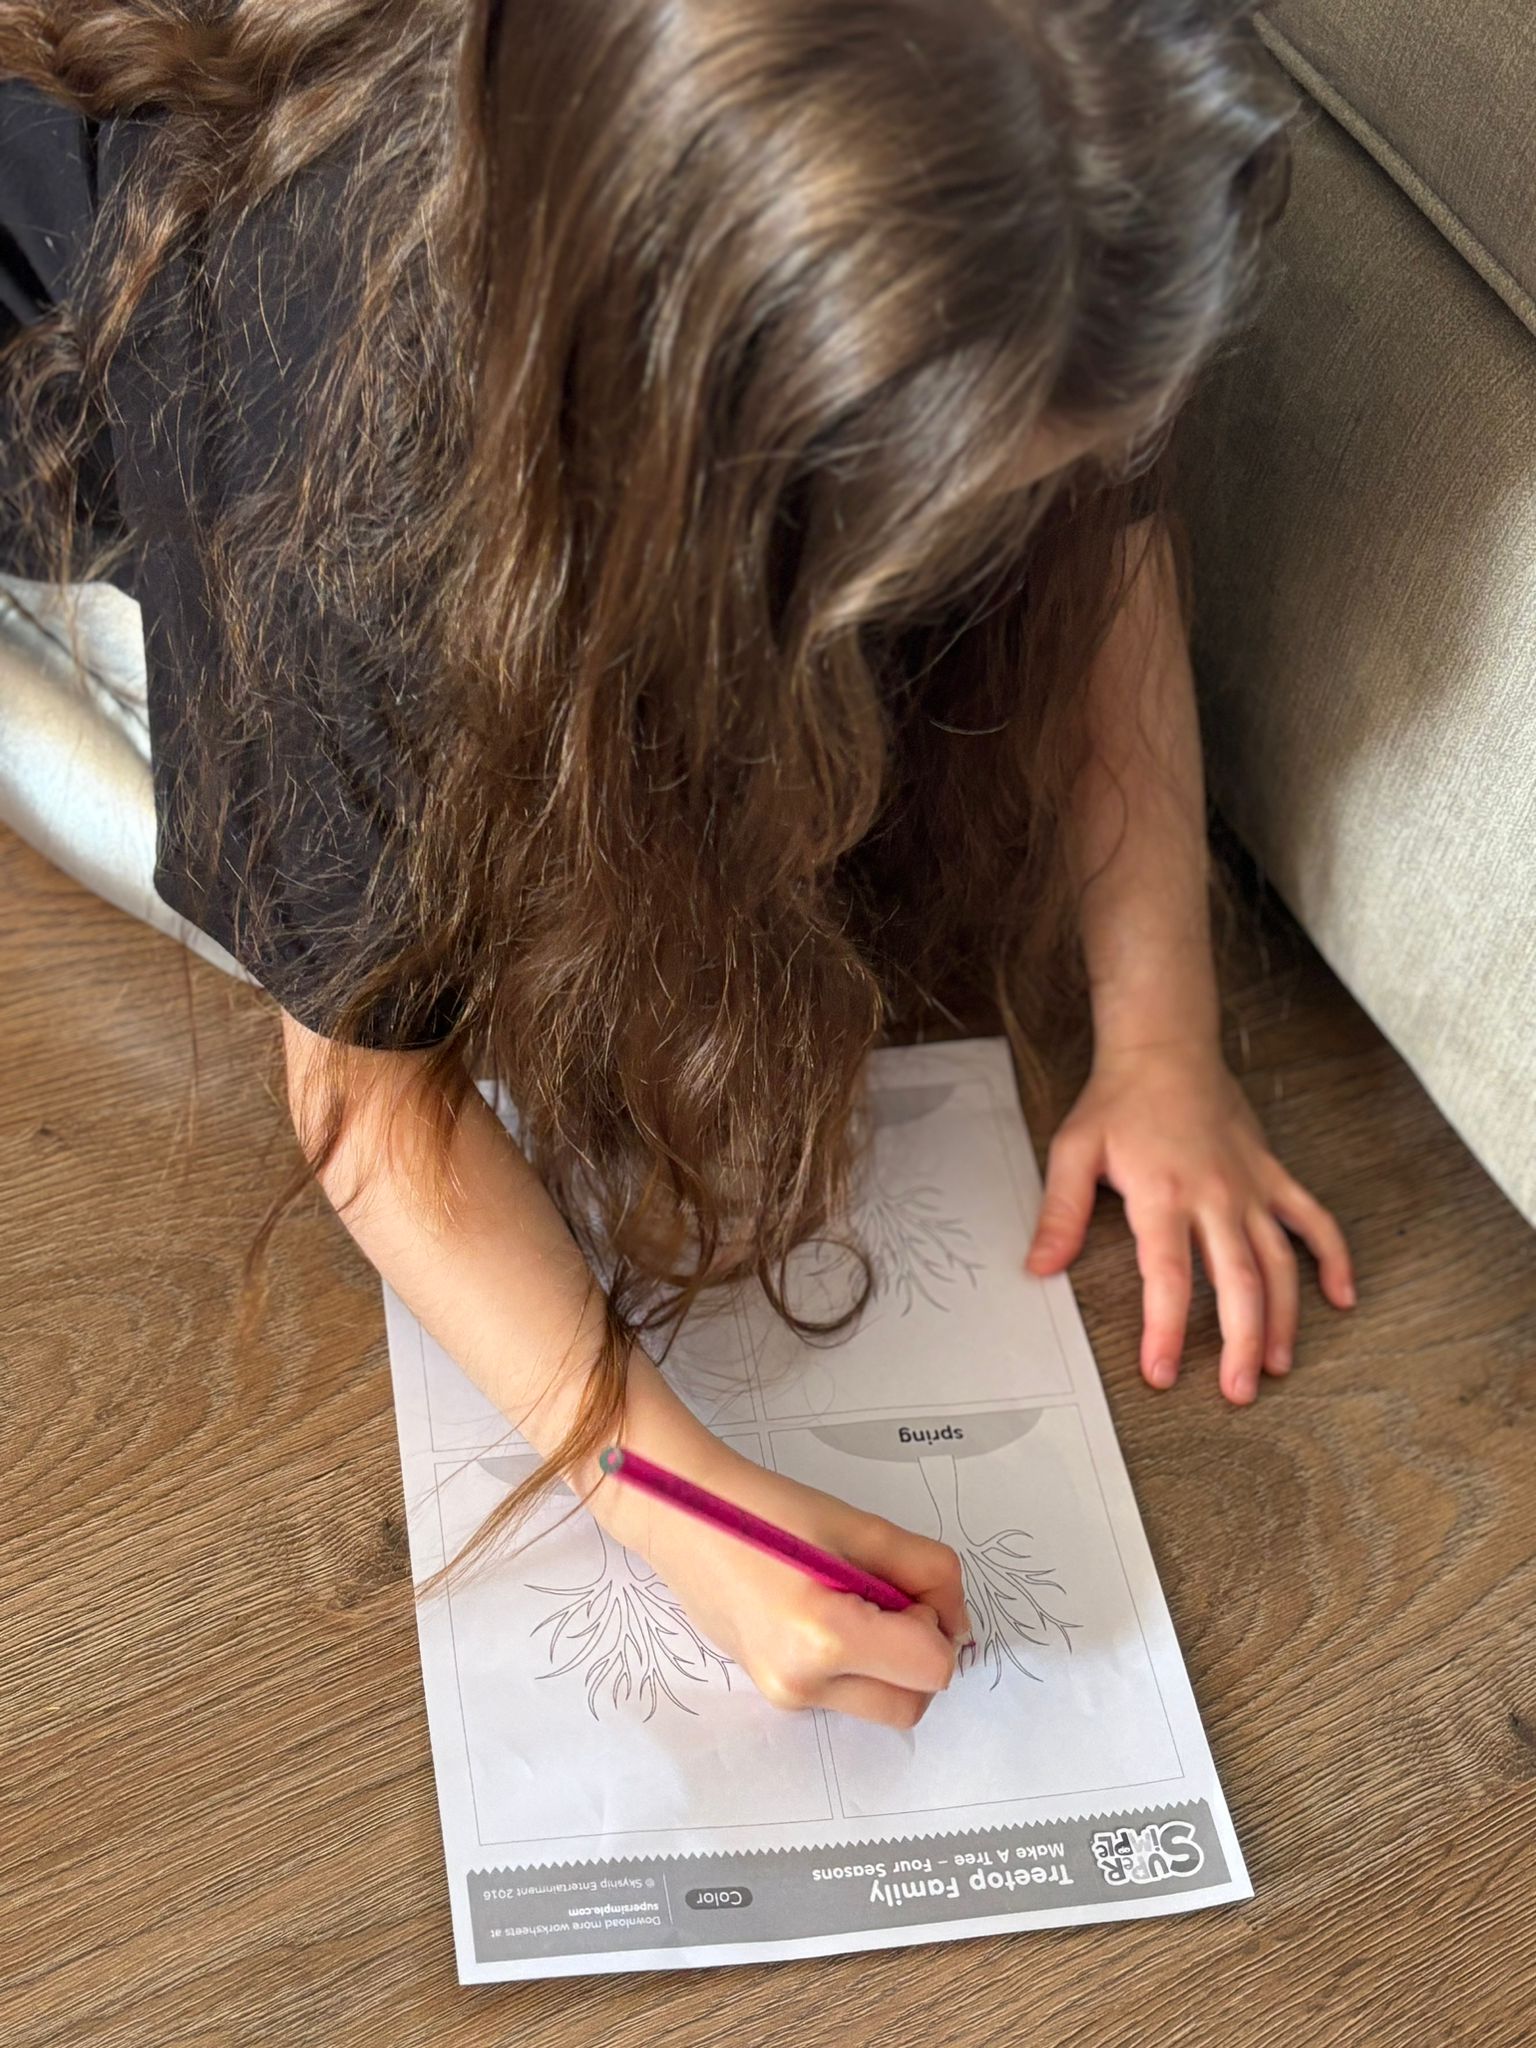
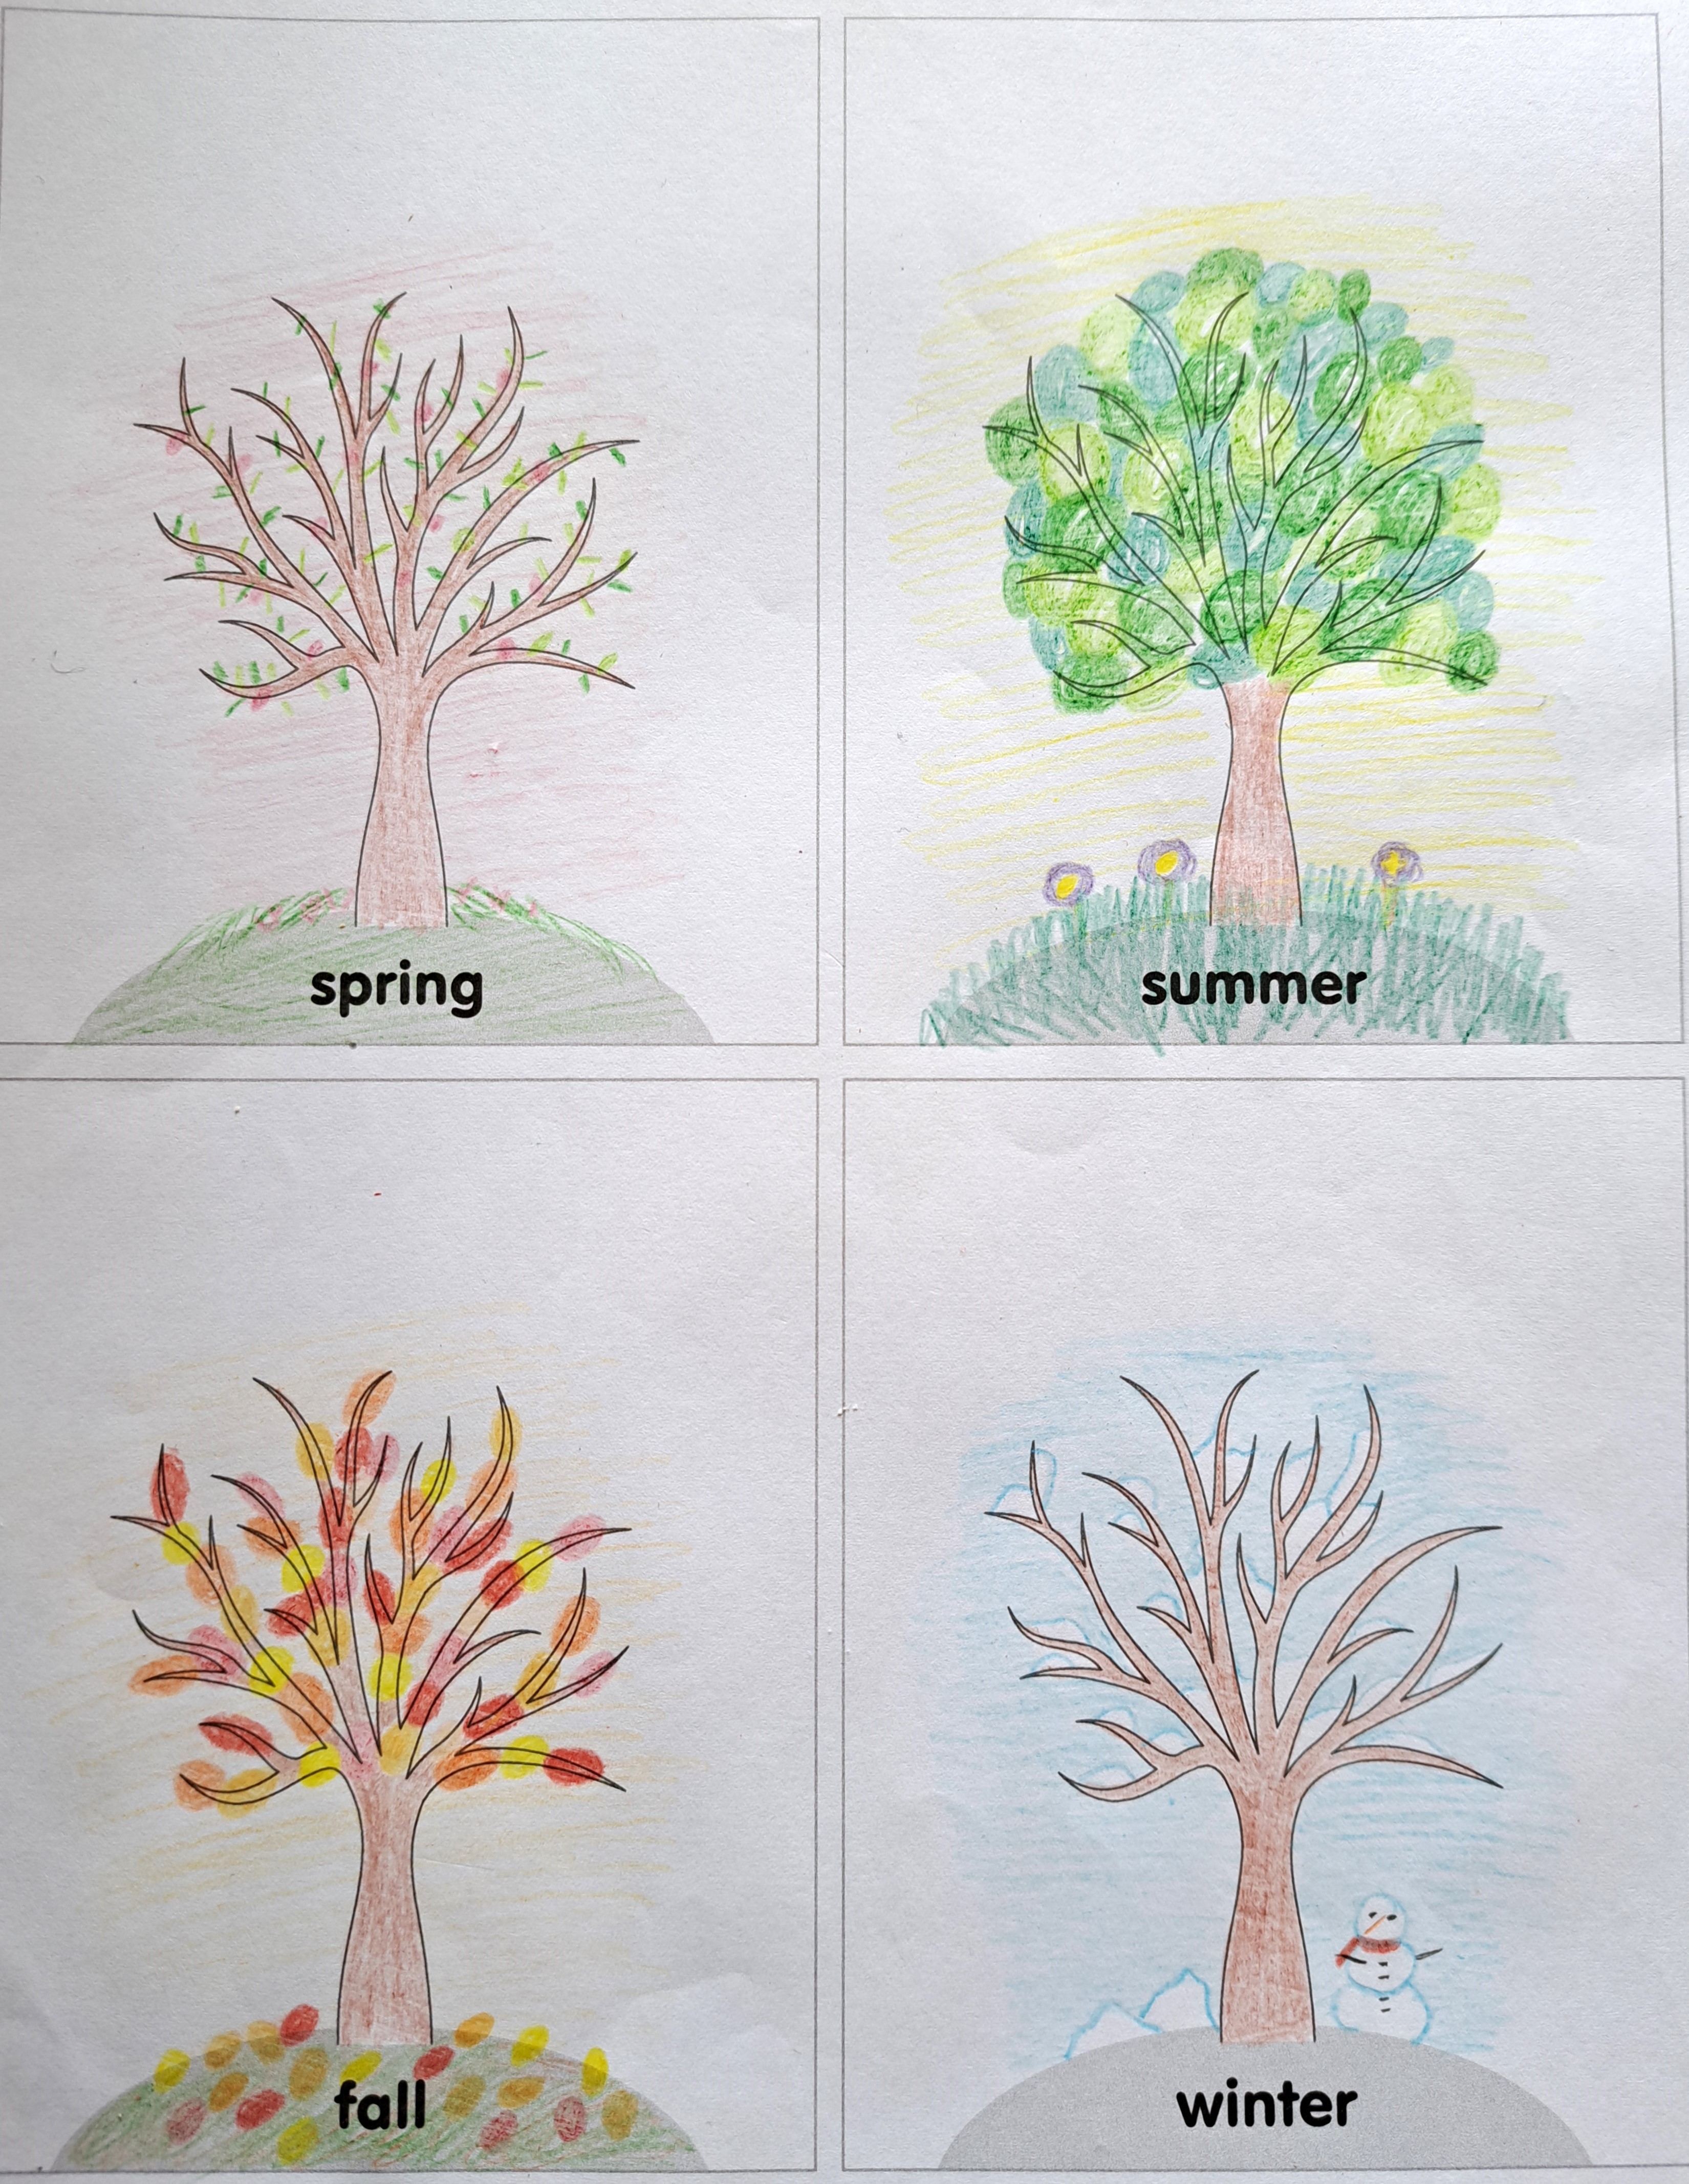
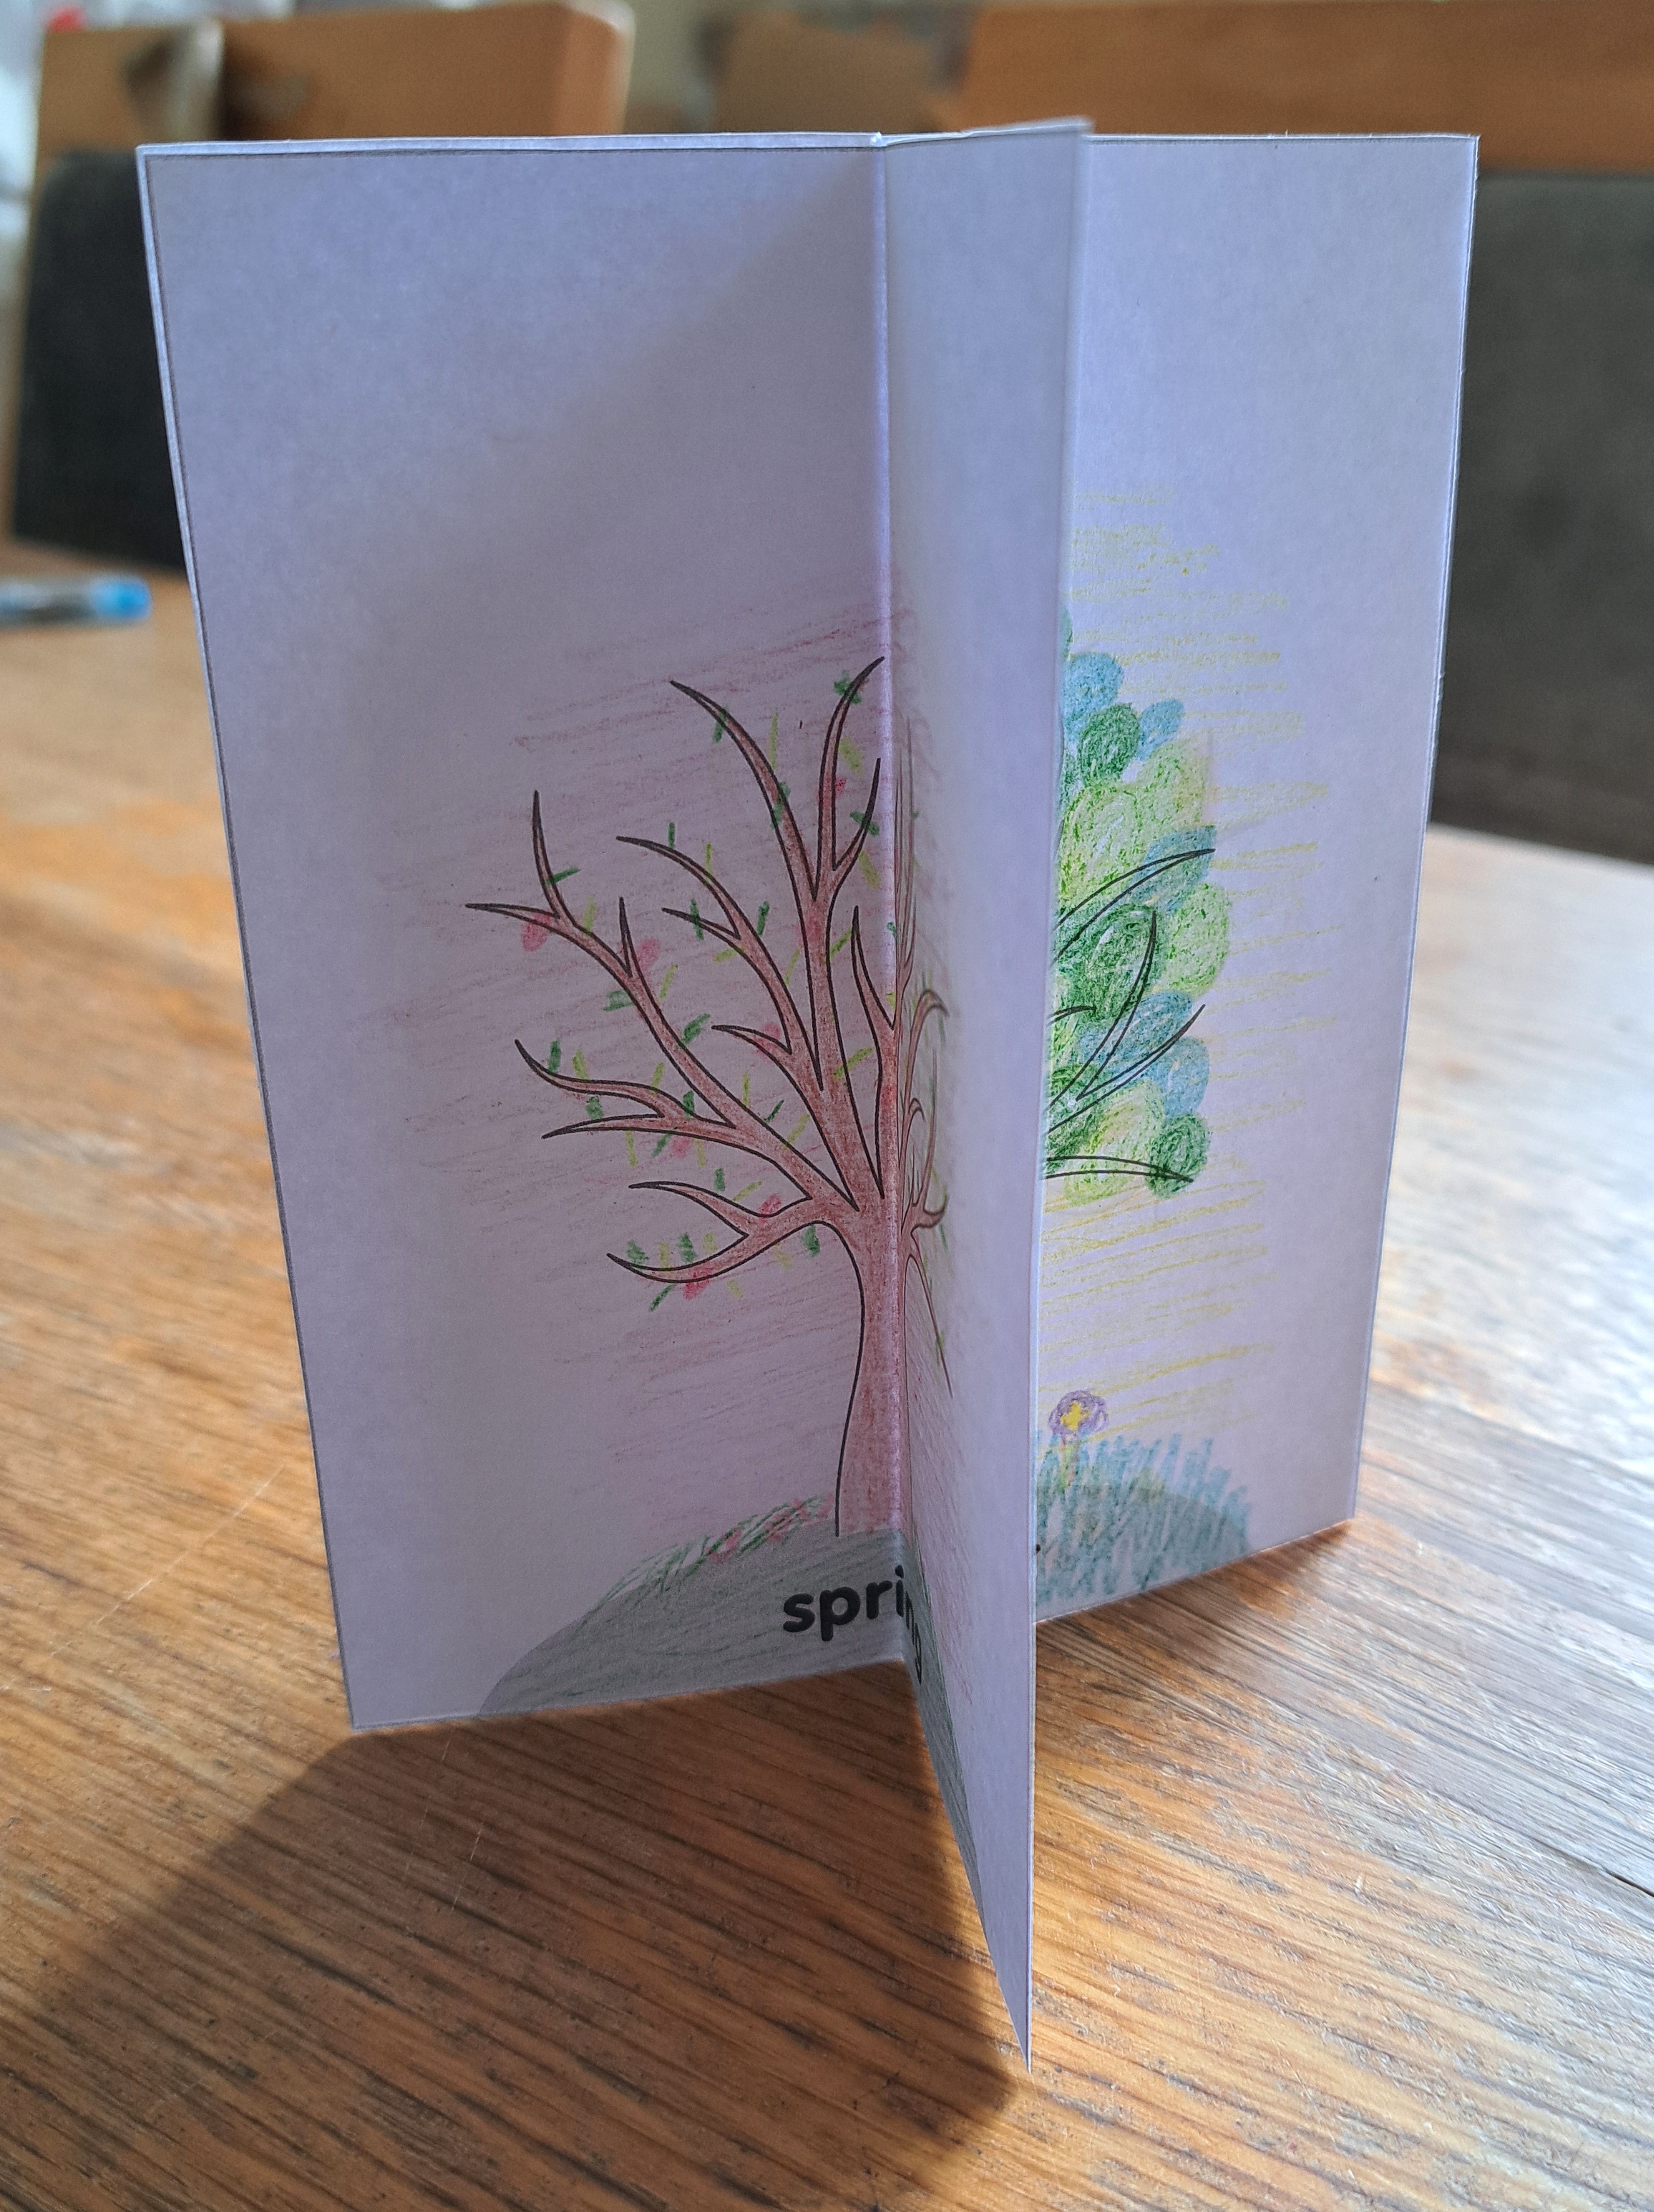
8. Seasonal tree activity: Give each child a seasonal tree worksheet. Have children colour each tree to reflect what the tree looks like
in that particular season (for example, spring tree has blossoms). Then invite families to cut out the trees, fold them in half, and glue
the trees together to create a 3D seasonal display!
9. Science Saturday Wrap-Up: If this is the last session, discuss whether families want to continue meetings for similar sessions. Plan
when and where the next session might be held - and if the children are interested, have the children "interview" the parents and each
other about what they liked best about Science Saturdays. Then the videos can be combined into a Celebration Video! Remind families
to take their plant home today!
Skills Learned/Practiced
STEM SKILLS
-Types of weather (symbols, description)
-Beaufort Wind Scale
-Names and characteristics of the seasons
-Understanding of how trees look in different seasons
NON-STEM SKILLS
-Writing/reading: writing name on name tag, reading days on rain gage labels
-Sequencing: ordering rain gages based on days of the week
-Public speaking: explaining chosen weather symbols and different seasons to group
-Creativity: decorating wind socks
-Fine motor skills: Tying ribbons onto wind socks
-Colouring: colouring trees to reflect how they look in different seasons
-Increased cultural awareness: understanding different parts of the world have different numbers and types of seasons
Outputs/Take-Homes from Session
-Pamphlets of suggested activities for seasonal changes
-Rain gages
-Wind sock
-Seasonal tree worksheet/display
-Interviews about Science Saturdays (if families want to do interviews)
-Plant from Session 1
-Pictures taken of families during session
Other Articles:
Quantum MechanicsA no-nonsense description of quantum mechanics with no maths or philosophy. The concepts are explained with animations, which are mainly computer simulations of electrons. |
|
|
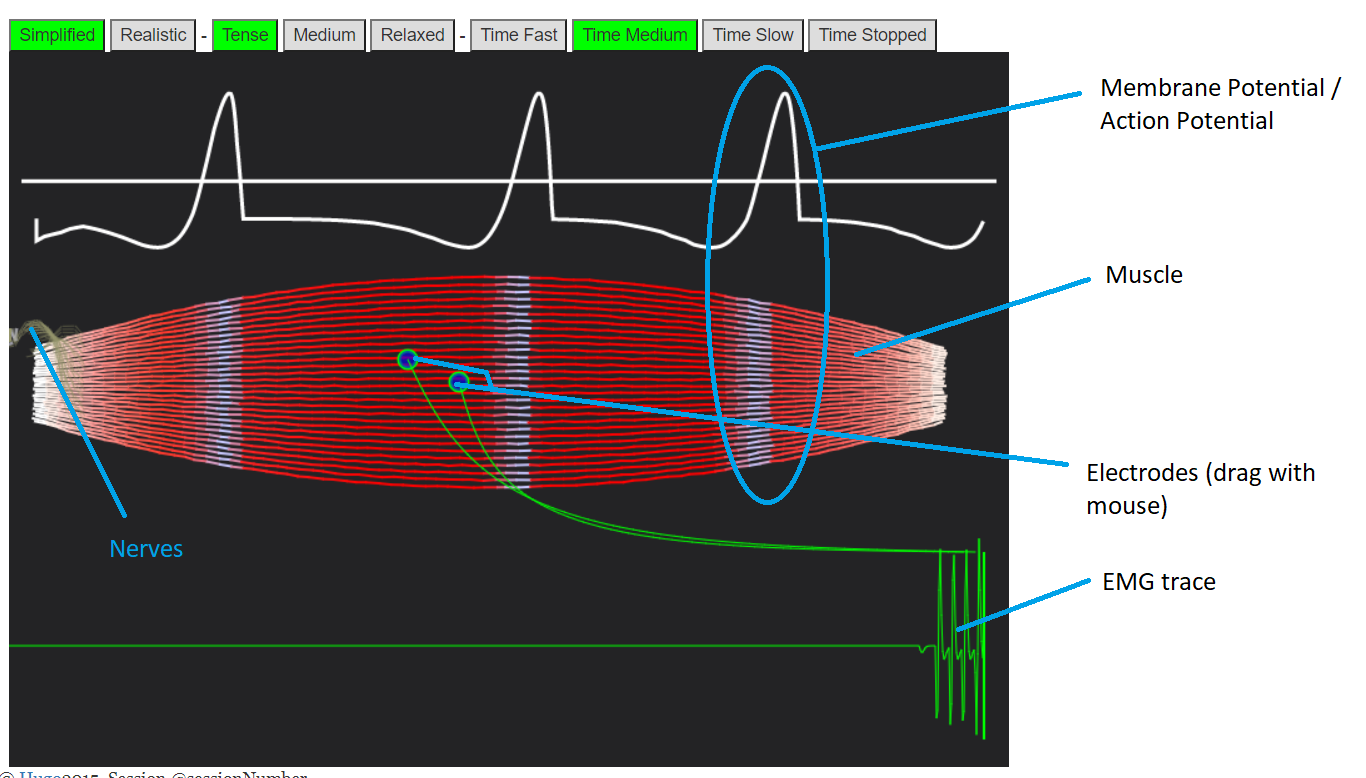
BodyWorks: Neuromuscular Activity / Muscle EMGAn interactive simulation showing how nerves travel to and down muscles, and how this gets picked up by EMG sensors. |
Simulation of flooding in New OrleansA not-very-accurate simulation of the flooding in New Orleans. |
|
© Hugo2015. Session @sessionNumber